What is the optimal inflation rate? We have pre-printed a meta-analysis summarizing 777 estimates from 116…
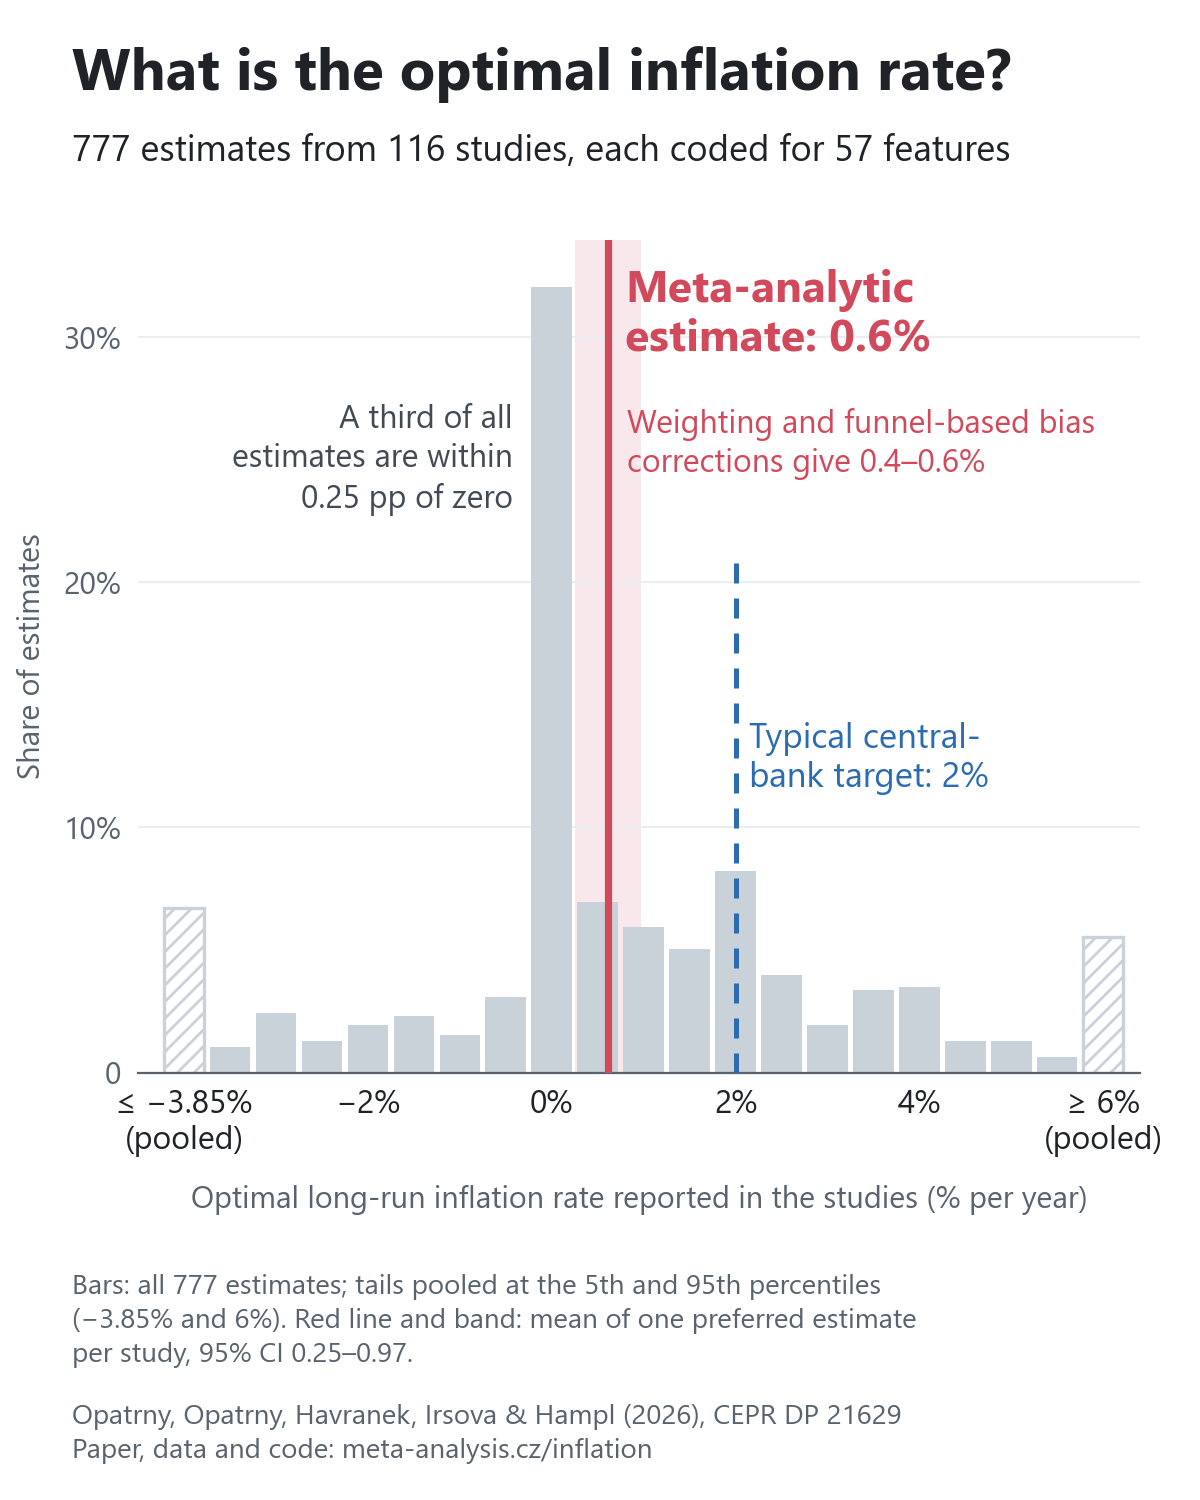
What is the optimal inflation rate? We have pre-printed a meta-analysis summarizing 777 estimates from 116 studies that try to provide an answer.
Our best guess is that this literature is consistent with optimal inflation of about 0.6%. This might have come as a disappointment to some of my co-authors, but for different reasons. One of them has spent a lot of time arguing for zero inflation on average. Another spent many years as a central banker defending the standard 2% target. Well, you can't make everyone happy!
The estimates differ a lot, and we show which modelling choices drive the differences.
This is our first meta-analysis where we really used AI a lot for data collection, although of course the AI workflow there already feels like pre-history. The prompts are public if you want to see how it was done.
Disclaimer: most of these optimal inflation estimates are not estimates in the classical sense but come from calibrated models, so publication bias corrections and other meta-analysis approaches are a bit tricky here.
Measurement error matters too: official inflation can overstate true inflation (it doesn't fully capture better quality and new products) or understate it (the cost of owning a home is often only partly captured or left out). Depending on how big the net bias is and how you read the models, the gap between 0.6% and 2% can shrink, grow, or even flip. We discuss this in the paper but perhaps that's a good topic for another meta-analysis.
Joint work with amazing co-authors Matej Opatrny, Martin Opatrný, Tomas Havranek, and Mojmír Hampl.
Links in the first comment.
Links the author added in the comments: