Reducing the biases of the conventional meta-analysis of correlations
T. D. Stanley, Hristos Doucouliagos, and Tomas Havranek (2025): "Reducing the biases of the conventional meta-analysis of correlations." Research Synthesis Methods 16(1): 42-59. https://doi.org/10.1017/rsm.2024.5.
T. D. Stanley1, Hristos Doucouliagos1 and Tomas Havranek2,3,4
1Department of Economics, Deakin University, Victoria, Australia 2Meta-Research Innovation Center at Stanford, Stanford, CA, USA 3Institute of Economic Studies, Faculty of Social Sciences, Charles University, Prague, Czechia 4Centre for Economic Policy Research, London, UK
Corresponding author: T. D. Stanley; Email: stanley@hendrix.edu
Received: 1 December 2023; Revised: 10 October 2024; Accepted: 14 October 2024
Abstract
Conventional meta-analyses (both fixed and random effects) of correlations are biased due to the mechanical relationship between the estimated correlation and its standard error. Simulations that are closely calibrated to match actual research conditions widely seen across correlational studies in psychology corroborate these biases and suggest two solutions: UWLS+3 and HS. UWLS+3 is a simple inverse-variance weighted average (the unrestricted weighted least squares) that adjusts the degrees of freedom and thereby reduces small-sample bias to scientific negligibility. UWLS+3 as well as the Hunter and Schmidt approach (HS) are less biased than conventional random-effects estimates of correlations and Fisher's z, whether or not there is publication selection bias. However, publication selection bias remains a ubiquitous source of bias and false-positive findings. Despite the relationship between the estimated correlation and its standard error in the absence of selective reporting, the precision-effect test/precision-effect estimate with standard error (PET-PEESE) nearly eradicates publication selection bias. Surprisingly, PET-PEESE keeps the rate of false positives (i.e., type I errors) within their nominal levels under the typical conditions widely seen across psychological research whether there is publication selection bias, or not.
Keywords: correlations; meta-analysis; publication selection bias; small-sample bias
Highlights
What is already known?
• Dozens, perhaps hundreds, of meta-analyses of correlations are conducted each year.
• It has only recently been shown that all inverse-variance weighted meta-analyses of correlations are biased.2
What is new?
• We investigate the statistical properties of alternative meta-analysis estimators of the population correlation coefficient with simulations that closely match typical research conditions widely seen across correlational studies in psychology with and without publication selection bias.
• We explore a novel correction, UWLS+3, along with an often-neglected approach of Hunter and Schmidt (HS). Both reduce these small-sample biases to scientific negligibility.
• UWLS+3 is the unrestricted weighted least squares weighted average that adjusts degrees of freedom, and the HS approach uses the sample size as the weight. Both effectively eliminate small-sample biases and are less biased than random effects calculated on correlations or Fisher's z whether there is publication selection bias or not.
• Despite the mechanical relationship between estimated correlations and their standard errors, precision-effect test/precision-effect estimate with standard error (PET-PEESE) effectively removes publication selection bias under the typical research conditions widely found across correlational studies in psychology.
Potential impact for RSM readers outside the authors' field
These meta-analysis methods apply widely to all disciplines where one wishes to conduct a systematic review of correlations.
1. Introduction
Correlations are widely used to summarize psychological research via inverse-variance weighted meta-analysis although, by conventional definitions, the variance (and standard error [SE]) of correlations is a function of the correlation estimate itself. What has yet to be fully recognized is that this dependence of the variance on the size of the correlation causes fixed and random-effects meta-analysis of correlations and partial correlations to be biased.1–2 The conventional approach to this dependence is to employ the Fisher's z transformation,3 as its SE is independent of the estimate of z.i Yet, many meta-analyses of simple, untransformed correlations are routinely conducted in psychology. For example, a survey found that a majority of the meta-analyses published in the Psychological Bulletin (108 of 200) concerned correlations. Within these 108 meta-analyses of correlations, 84.3% did not use the Fisher's z transformation, but rather, the simple untransformed correlations.4
We follow previous studies which found that conventional meta-analyses (i.e., inverse-variance weighted averages, fixed and random effects, without additional corrections) of bivariate and partial correlations are biased because sample correlations are inversely correlated with their variances.1–2 Fortunately, these biases are small-sample biases. A new estimator, UWLS+3, is introduced below that reduces these biases to scientific negligibility by making a simple adjustment to the degrees of freedom. However, past studies assumed that the sample sizes were constant across all studies within a meta-analysis, there was no excess heterogeneity, and no publication selection bias (PSB). While these assumptions were necessary to isolate and to identify the small-sample bias caused by a correlation's mechanical inverse correlation with its own SE, none of these conditions hold, even approximately, for the majority of meta-analyses of social science research. Relaxing these assumptions constitutes our main contribution to this stream of research.
The range of sample sizes synthesized by the typical meta-analysis is many times its median value. Thus, at least some studies in the majority of meta-analyses will be sufficiently large to reduce a correlation's small-sample bias to practical negligibility. Second, although not every area of research selects for statistical significance and thereby produces PSB, it is rare when PSB can be ruled out a priori. When present, PSB can be substantial, creating high rates of false positives in conventional meta-analyses.5 Lastly, heterogeneity among psychological studies is rather large: = 74%, tau > .3d.4 In this study, we show that a new small-sample correction, UWLS+3, and the old but often-overlooked Hunter and Schmidt (HS) approach6–7 reduce meta-analysis bias to rounding errors and investigate whether conventional meta-analysis (uncorrected inverse-variance weighted averages) will still be biased when there is a wide range of sample sizes and heterogeneity, with and without accompanying selection for statistical significance. In short, conventional, inverse-variance weighted meta-analyses are still biased under typical research conditions seen in psychology. However, we do not stop there. We also identify those meta-analyses methods that have no notable biases with or without PBS as well as those that are able to maintain their nominal type I errors (that is, those that do not have inflated rates of false positives) even with publication bias.
2. Correlation and its variances
The conventional formula for the Pearson (bivariate) correlation coefficient, , is:
When testing whether the association between and is statistically significant (i.e., H0: = 0), 's variance is:
and is the corresponding conventional test statistic. Correlation's -value is also equal to the -value for the slope coefficient from the simple linear bivariate regression between and . See Stanley et al.2 for numerical-analytic proof.
In contrast, conventional meta-analysis uses a different variance for correlations:3,6,7
is often considered the "correct" variance formula for a correlation when conducting meta-analyses.1,3,6 Note that the differences between these variance formulae are: squares 's numerator, , and 's degrees of freedom, , are one fewer. Because and , for all sample sizes and {0 or 1}. Simulations reported in Table 1, below, establish that using causes conventional meta-analyses to be twice as biased as those which use . These results corroborate prior findings.1,2 The main reason is that squaring the numerator reinforces the unwelcome mechanical relationship between the estimated correlation and its variance. Despite being the "correct" variance formula, is less suitable than to be used in the weighting of sample correlations for meta-analysis.
Finally, there are different ways to calculate correlations. Following Gustafson8 and Fisher,9 Stanley et al.2 demonstrated that Equation (4) gives the exact same values for estimated correlations as the more conventional correlation formula, Equation (1).
where = − 2. is the conventional -test for the statistical significance of the slope coefficient of a bivariate regression or, equivalently, the -value of correlations using . This -formula for correlations, Equation (4), is central to a new small-sample correction, UWLS+3.
3. Meta-analysis of correlations
Random-effects (REs) weighted averages are, by far, the most employed meta-analysis approach used to systematically review and summarize correlations across studies in a given area of research in psychology. RE is, thereby, the conventional standard upon which to establish the bias of the conventional meta-analyses of correlations—see Table 1. RE serves as the baseline from which to evaluate the statistical performance of alternative meta-analysis methods.
| Design: Het/PSB | Design: | Design: | Bias: RE2 | Bias: RE1 | Bias: UWLS2 | Bias: UWLS1 | Coverage: RE2 | Coverage: RE1 | Coverage: UWLS2 | Coverage: UWLS1 | RMSE: RE2 | RMSE: RE1 | RMSE: UWLS2 | RMSE: UWLS1 |
|---|---|---|---|---|---|---|---|---|---|---|---|---|---|---|
| None | .447 | .1058 | .0097 | .0042 | .0103 | .0042 | .8595 | .9572 | .8362 | .8925 | .0142 | .0110 | .0147 | .0110 |
| None | .243 | .1069 | .0065 | .0028 | .0069 | .0030 | .9261 | .9562 | .9177 | .9318 | .0139 | .0123 | .0140 | .0123 |
| None | .110 | .1079 | .0028 | .0010 | .0030 | .0011 | .9530 | .9603 | .9483 | .9493 | .0132 | .0126 | .0131 | .0125 |
| Average | .0063 | .0027 | .0067 | .0028 | .9129 | .9579 | .9007 | .9245 | .0138 | .0120 | .0139 | .0120 | ||
| Het | .447 | .6023 | .0075 | .0007 | .0197 | .0057 | .8991 | .9357 | .7676 | .8960 | .0192 | .0173 | .0254 | .0162 |
| Het | .243 | .6491 | .0036 | −.0009 | .0138 | .0039 | .9247 | .9331 | .8928 | .9377 | .0228 | .0216 | .0244 | .0192 |
| Het | .110 | .6638 | .0016 | −.0006 | .0068 | .0019 | .9276 | .9308 | .9404 | .9511 | .0240 | .0229 | .0225 | .0201 |
| Average | .0042 | −.0003 | .0135 | .0038 | .9171 | .9332 | .8669 | .9283 | .0220 | .0206 | .0241 | .0185 | ||
| PSB | .447 | .5668 | .0190 | .0113 | .0260 | .0124 | .7573 | .8686 | .5988 | .8019 | .0250 | .0194 | .0301 | .0190 |
| PSB | .243 | .6171 | .0527 | .0451 | .0478 | .0363 | .2305 | .3304 | .2846 | .4439 | .0562 | .0488 | .0510 | .0400 |
| PSB | .110 | .6879 | .0955 | .0894 | .0819 | .0725 | .0187 | .0226 | .0368 | .0560 | .0982 | .0919 | .0842 | .0748 |
| Average | .0557 | .0486 | .0519 | .0404 | .3355 | .4072 | .3067 | .4339 | .0598 | .0534 | .0551 | .0446 | ||
| Het and PSB average | .0300 | .0242 | .0327 | .0221 | .6263 | .6702 | .5868 | .6811 | .0409 | .0370 | .0396 | .0316 |
Note: HET/PSB describes different assumed conditions. With PSB, the simulations force both heterogeneity and 50% of the study results to be selected for statistical significance that is publication bias, Het assumes only heterogeneity, and None allows neither. is the "true" population correlation. Bias is the difference between the meta-analysis estimate calculated from 50 estimated correlation coefficients and averaged across 10,000 replications. RMSE is the square root of the mean squared error. Coverage is the proportion of 10,000 meta-analyses' 95% confidence intervals that contain . RE is the random-effect's estimate of the mean, and UWLS is the unrestricted weighted least squares' estimate of the mean. The subscripts (1 and 2) refer to the use of either correlation variance, , from Equation (2) or from Equation (3) to calculate UWLS' and RE's weighted averages. is a relative measure of heterogeneity.
3.1. The unrestricted weighted least squares (UWLS) weighted average
The UWLS is an alternative simple weighted average that has statistical properties practically equivalent to RE under ideal conditions for RE and is notably superior if there is publication bias or if small-sample studies are more heterogeneous.10–13 Also, UWLS has been shown to be widely and notably superior to RE in most applications in psychology and medicine.13,14
UWLS is calculated from the simple meta-regression:
where is the number of estimates contained in the meta-analysis, is the conventional regression error term, and is the SE of the th correlation calculated as the square root of either or from their respective formulas; that is, Equation (2) or Equation (3). Without assuming the normality of but merely that it is independently and identically distributed (i.e., , the Gauss–Markov Theorem proves that UWLS is unbiased and minimum variance or, more precisely, BLUE (best linear unbiased estimator).15–16 Any standard statistical software for regression analysis will automatically estimate UWLS (the slope coefficient, ), its standard error, CI, and test statistics.
Stanley et al.17 offered a new correction, UWLS+3, for the small-sample biases of the conventional meta-analysis of partial correlations first identified in Stanley and Doucouliagos.1 Like the biases of the meta-analysis of partial correlations, Stanley et al. (Table 1)2 show that conventional RE's small-sample biases are positive, can be of a notable magnitude for small samples, and are halved if replaces the "correct" variance, . Unfortunately, even with this change in variance, the small-sample biases can be larger than rounding error (.01). We seek to reduce further the biases of meta-analyses of correlations. A century ago, Fisher18 argued that what is true for correlations is also true for partial correlation:
Sampling distribution of the partial correlation obtained from pairs of values, when one variable is eliminated, is the same as the random sampling distribution of a total correlation derived from (-1) pairs. By mere repetition of the above reasoning it appears that when variates are eliminated the effective size of the sample is diminished to (-). (Fisher, p. 330)18
Perhaps then, the reverse is also true: what is true for partial correlations is also true for correlations?
To address this question and to better understand the nature of the biases of the conventional meta-analysis of correlations, we first conduct a numerical analysis. To do so, we run simulation experiments of 10,000 replications, each doubling the sample size of the previous experiment ( = {10, 20, 40, 80, 160, 320, 640, 1280 & 25, 50, 100, 200, 400, 800, 1600, 2500}) for ; otherwise, these simulations use the same design as those reported in (Stanley, Doucouliagos, Maier and Bartos).2 Figure 1 plots conventional meta-analysis biases (i.e., RE's bias using the "correct" variance, ) and UWLS' biases using against the inverse of degrees of freedom (1/). Figure 1 illustrates that the use of halves these biases, a doubling of the sample size also halves these biases, and the biases of UWLS are effectively an exact function of the inverse of degrees of freedom (1/):
That is, numerical analysis reveals a near perfect inverse relationship of UWLS' biases to degrees of freedom, , explaining over 99.99% of the variation in UWLS's bias ( 99.999%) and leaving only a negligible random error. Note also that UWLS's bias shrinks virtually to zero asymptotically (i.e., as ), 95% CI = (−0.000030; 0.000053). This near perfect fit demonstrates that these are small-sample biases and suggests that a modification to the degrees of freedom may correct these biases.
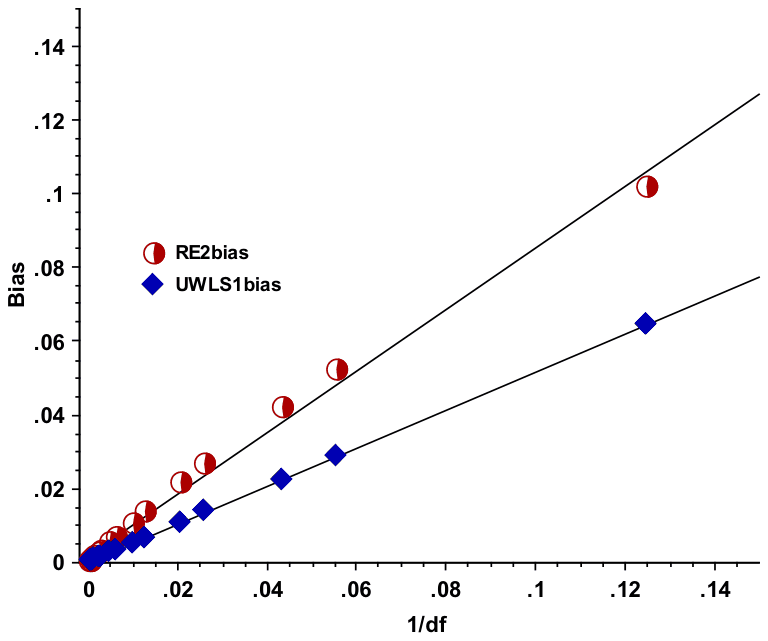
Figure 1 also reveals a very close relationship of RE's bias with inverse , although its fit is not nearly as close as UWLS'.ii RE's standard error of the estimate, which is the typical deviation of these biases from their predicted values, is 38 times larger than UWLS'. We focus on adjusting UWLS' degrees of freedom (giving UWLS+3) rather than adjusting RE because we find that UWLS+3 has smaller biases and better statistical properties than adjusting RE.17 In part, this is due to the fact that RE must first estimate the heterogeneity variance before an estimate of mean effect can be calculated and thereby creates an additional source of variation and sampling error that UWLS does not have. Furthermore, any small-sample correction to RE is more biased than any of the alternative weighted averages in the presence of PSB just as RE is widely known to be more biased than UWLS when there is PSB.10–12 Below, we show that UWLS+3, can reduce these small-sample biases to scientific triviality.
As suggested by our numerical analysis, an adjustment to degrees of freedom may remove UWLS' small-sample biases. Because Gustafson's8 formula for a correlation, Equation (4), is itself a function of degrees of freedom, an adjustment to the degrees of freedom there might remove these small-sample biases? UWLS+3 is the unrestricted weighted least squares weighted average (i.e., Equation (5)) after three is added to the degrees of freedom in Equations (4) and (2) giving:
The -values in Equation (6) are the -values from the estimated bivariant regression slope coefficient or they may be equivalently calculated from the conventional -value for correlations, . Again, correlations calculated from Equation (4), with = − 2, produce identical correlation values as those calculated from conventional formulas for correlations.2 Note that that adding exactly three to the degrees of freedom is an arbitrary choice; adding four would further reduce the bias. But, as we have noted, once three are added, the remaining bias becomes trivial, so we prefer the least biased correction.
It is important to note that these small-sample corrections of correlations, and , should not be applied to individual stand-alone correlations because it is widely known that individual correlation estimates, and partial correlation coefficients, are biased downward.6,17,19 Applying this small-sample adjustment to stand-alone correlations would then only make a small downward bias worse. Rather, these transformations are merely an intermediate step in the calculations of meta-analysis weighted averages of correlations.
3.2. The HS approach to the meta-analysis of correlations
Hunter and Schmidt6,7 offered an alternative meta-analysis approach (HS), which they argued is superior to Fisher's z.iii HS uses the sample size, n, of each study as the weights. Thus, like Fisher's z, HS avoids any dependence arising from the weights being dependent on the estimated correlations and thereby their sampling errors. The HS meta-analysis estimate of the mean correlation is:
The variance of HS is not calculated as the conventional RE and FE meta-analysis by the inverse of the sum of the weights, but rather as:
where the correlations' standard deviation, , is the square root of the weighted sum of squared deviations from the mean, :6,20
Table 2 compares the statistical properties of the resulting HS estimator to REz, UWLS+3, and precision-effect test/precision-effect estimate with standard error (PET-PEESE).
3.3. Fisher's z transformation
An issue that has long been recognized by meta-analysts is that the SEs of correlations are a mathematical function of the correlation itself—recall Equations (2) and (3). This dependence is the source of the small-sample bias of the meta-analysis of partial correlations.1 Strictly speaking, the inverse-variance weights are no longer optimal and create bias. To circumvent this issue, meta-analysts often first transform correlations to Fisher's z, calculate the random-effects estimate, then convert this RE estimate from terms of z back to a correlation.3,iv Here, we call this z-transformed RE estimator, REz.
3.4. PET-PEESE model of publication selection bias
Publication selection bias (PSB), variously called: the "file drawer problem," "publication bias," "reporting bias," "p-hacking," and "questionable research practices" (QRP), has long been recognized by social scientists and medical researchers as a central problem for meta-analysis and empirical research in general. PSB has been offered as a leading explanation of the widely discussed "replication crisis," and recent meta-research surveys have shown that PSB is the central suspect in the exaggeration of psychology's typical reported effect sizes and statistical significance.21–23
PET-PEESE ranks among the best methods to accommodate and reduce PSB.5,22,24,25 PET-PEESE is calculated as the slope coefficient from one of two meta-regressions:
using weighted least squares (WLS) with as the weights.25 If the regression coefficient, , is statistically significant (one-tail = .10), then the estimate of is PET-PEESE. Otherwise, the estimate of the regression coefficient, , is PET-PEESE.
PET-PEESE has been used in dozens of meta-analyses in psychology. For example, PET-PEESE anticipated the failure of ego depletion to replicate.26,27 Kvarven et al.5 conducted a systematic review of all pairs of preregistered multi-lab replications and meta-analysis. They compared RE, 3PSM (i.e., three-parameter selection model of publication bias), and PET-PEESE to the findings from these large-scale preregistered, multi-lab replications. On average, RE was three times larger than the corresponding replication result, bias = .26 d (Cohen's d), and RE had a 100% "false-positive" rate.5 3PSM was little better. In contrast, PET-PEESE's bias, relative to these preregistered multi-lab replications, is only .051d, and PET's false-positive rate is much lower than RE's, especially so (9%) when Cohen's28 probabilistic proof of a null effect defines "false positive."29,v
Incidentally, PET-PEESE belongs to the same family of UWLS estimators as UWLS+3 along with other methods that progressively reduce publication bias: WAAP (weighted average of the adequately powered)12 and WILS (weighted and iterated least squares).30,vi UWLS may be seen as a PET-PEESE meta-regression model that uses the same weights but does not include any independent variable: neither SE nor .
Table 2 reports simulations for PET-PEESE (PP) and a second version of PET-PEESE that regresses Fisher's z on its SE or variance (PPz). PPz first converts correlations to Fisher's z, regresses these zs using corresponding versions of Equations (12) and (13), and then transforms PPz back to a correlation. PPz avoids the correlation of r and its SE when there is no publication bias. Another alternative solution, which we do not simulate here, would be to use the square root of the inverse sample size as an instrument for the standard error in PET-PEESE.31,32 Among other things, the instrumental-variable PET-PEESE technique accounts for the mechanical correlation between r and its SE. See Irsova et al.32 for simulations of this instrumental-variable approach.
| Bias UWLS+3 | Bias REz | Bias HS | Bias PP | Bias PPz | Coverage UWLS+3 | Coverage REz | Coverage HS | Coverage PP | Coverage PPz | RMSE UWLS+3 | RMSE REz | RMSE HS | RMSE PP | RMSE PPz |
|---|---|---|---|---|---|---|---|---|---|---|---|---|---|---|
| Design: No heterogeneity or PSB | ||||||||||||||
| −.0002 | .0013 | −.0015 | .0128 | −.0002 | .9537 | .9588 | .9449 | .8674 | .9488 | .0100 | .0101 | .0101 | .0198 | .0154 |
| −.0001 | .0008 | −.0010 | .0083 | −.0001 | .9496 | .9571 | .9402 | .9266 | .9487 | .0120 | .0121 | .0119 | .0199 | .0181 |
| .0000 | .0005 | −.0004 | .0033 | −.0012 | .9452 | .9540 | .9375 | .9435 | .9467 | .0127 | .0128 | .0126 | .0217 | .0221 |
| .0001a | .0008 | −.0010 | .0081 | −.0005 | .9495 | .9566 | .9409 | .9125 | .9481 | .0115 | .0117 | .0116 | .0205 | .0185 |
| Type I error rate | .0233 | .0185 | .0254 | .0248 | .0257 | |||||||||
| Design: Only heterogeneity | ||||||||||||||
| .0015 | −.0009 | −.0070 | .0274 | −.0004 | .9547 | .9368 | .9365 | .8170 | .9718 | .0153 | .0173 | .0166 | .0343 | .0211 |
| .0010 | −.0009 | −.0050 | .0192 | −.0004 | .9559 | .9356 | .9457 | .9347 | .9749 | .0186 | .0212 | .0186 | .0321 | .0252 |
| .0005 | −.0005 | −.0024 | .0056 | −.0066 | .9571 | .9349 | .9498 | .9684 | .9777 | .0200 | .0226 | .0192 | .0350 | .0366 |
| .0010 | −.0008 | −.0048 | .0174 | −.0025 | .9559 | .9358 | .9440 | .9067 | .9748 | .0180 | .0204 | .0181 | .0338 | .0276 |
| Type I error rate | .0227 | .0342 | .0255 | .0074 | .0116 | |||||||||
| Design: Both heterogeneity and 50% PSB | ||||||||||||||
| .0079 | .0093 | .0001 | .0198 | −.0076 | .9190 | .8985 | .9463 | .8912 | .9598 | .0165 | .0184 | .0143 | .0284 | .0217 |
| .0341 | .0444 | .0274 | .0141 | −.0058 | .5291 | .3383 | .6297 | .9463 | .9650 | .0380 | .0481 | .0318 | .0292 | .0251 |
| .0716 | .0890 | .0653 | .0057 | −.0214 | .0657 | .0202 | .0861 | .8260 | .8632 | .0739 | .0914 | .0677 | .0611 | .0643 |
| .0379 | .0476 | .0309 | .0132 | −.0116 | .5046 | .4190 | .5540 | .8878 | .9293 | .0428 | .0526 | .0379 | .0396 | .0370 |
| Type I error rate | .9961 | .9993 | .9961 | .0169 | .0113 | |||||||||
| Design: Averaged across all heterogeneity and PSB conditions | ||||||||||||||
| .0194a | .0242a | .0179a | .0153 | −.0070 | .7302 | .6774 | .7490 | .8973 | .9521 | .0304 | .0365 | .0280 | .0367 | .0323 |
Note: The design conditions in Table 2 are the same as in Table 1, where the three rows differ as = {.447, .243, .110}. is the "true" population correlation. Bias is the difference between the meta-analysis estimate calculated from 50 estimated correlation coefficients and averaged across 10,000 replications. RMSE is the square root of the mean squared error. Coverage is the proportion of 10,000 meta-analyses' 95% confidence intervals that contain . Type I errors, by definition, must assume that = 0, and thereby only be reported once for each design condition. UWLS+3, as discussed in text, is the unrestricted weighted least squares meta-average with three additional degrees of freedom, REz is the random effects estimate of the mean correlation after being transformed back from Fisher's z, HS is the Hunter and Schmidt approach, PP is PET-PEESE, and PPz is the PET-PEESE that uses the Fisher's z transformation. Biases reported as ".0000" have absolute values < .00005. The fourth row in bold italics for each design is the average of the above three design conditions. a Average biases are averaged across the absolute values of the biases.
3.5. An illustration
Eastwick et al. conducted a meta-analysis of the correlations of physical attractiveness and earning potential on men and women's romantic evaluations.33 The research literature suggests that: "The attractiveness of the target affects men's romantic evaluations more than women's, and the earning prospects of the target affect women's romantic evaluations more than men's" (p. 627).33 This meta-analysis reported several random-effects estimates but focused on the gender differences and their moderators. For the sake of illustrating the methods discussed above, we focus on the correlation between the perceived earning potential of candidate men on women's romantic evaluations. Conventional random-effects estimate the correlation of the earnings potential of the target on women's romantic evaluations as: 0.128; 95% CI (0.092, 0.164), k = 73. Using REz does not notably affect these values: 0.127; 95% CI (0.092, 0.163). This is to be expected as the correlation is small, and small correlations have smaller small-sample biases. Furthermore, the sample sizes vary widely from 11 to over 7,000 with most studies having n > 100.
On the other hand, UWLS+3 reduces the RE estimate by over 60%: 0.050, 95% CI (0.022, 0.078). That is, UWLS+3 reduces a small correlation to a trivial one by Cohen's benchmarks.34 It is important to note that Eastwick et al.33 accept Cohen's definition of "small" effect sizes (.1 ≤ r ≤ .3) and use it to characterize their central findings—(Eastwick et al., Abstract).33 UWLS+3 is calculated by first adjusting each correlation by Equation (6), giving , then applying the simple UWLS regression, Equation (5), of t-values = / (DV) with precision, 1/, as the only explanatory variable and no constant—see Equations (6), (7), and (8) and the Supplement for the STATA code. HS produces virtually the same mean estimate as does UWLS+3: 0.047, 95% CI (0.014, 0.079).
The primary reason that HS and UWLS+3 notably reduces the effect size is likely publication selection bias. UWLS, in general, is widely known to reduce PSB more than corresponding random-effects, and the below simulations confirm that both HS and UWLS+3 are less biased than either RE or REz. HS is also less vulnerable to PSB because, like UWLS, its weights are not moderated by the additive heterogeneity variance, tau.2 However, these simulations also show that all weighted averages are notably biased when there is a small correlation, PSB, and notable heterogeneity, as we see here (tau = 0.128; = 85%).
Testing whether the coefficient on SE in Equation (12) is statistically significant is a test for PSB (the Egger test), also called the funnel-asymmetry test, or FAT.25,31,35 The estimated FAT-PET meta-regression, Equation (12), for these earnings-romance correlations and the associated Fisher's z (Fz) are:
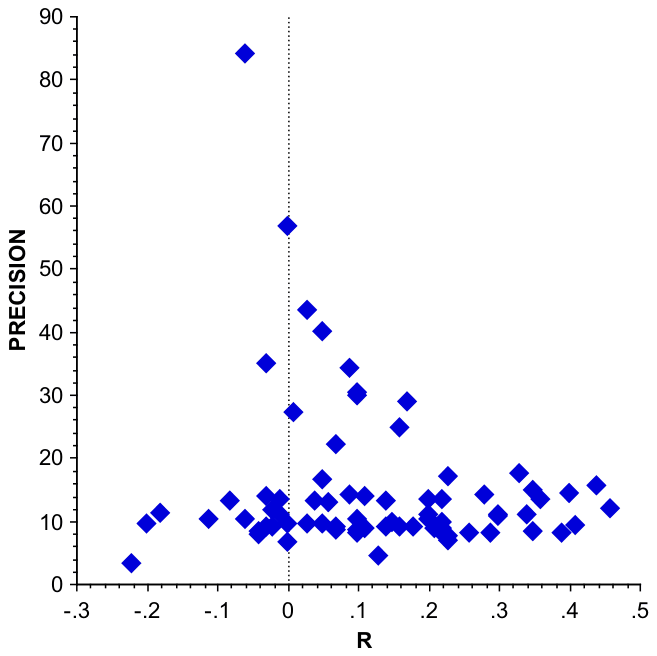
where the second lines report the t-values of the intercept (PET) and slope coefficients (FAT) in parentheses, and both meta-regressions use inverse variances as WLS weights. Also note that is different in Equations (14) and (15). For correlations, is its standard error, and Fisher's z employs 1/sqrt(n−3) as its standard error. In both cases, PET fails to reject the null hypothesis that the earnings-romance correlation for women is zero (t = {−1.37; −1.55}; p > .05). In other words, once potential publication selection bias (or generally funnel asymmetry) is accommodated, no evidence of a positive earnings-romance correlation remains.vii Also, both tests of the slope coefficients (FAT) are consistent with funnel asymmetry and, therefore, PSB (t = {5.17; 5.39}; p < .001) and that this size of this bias is quite large.36,viii This funnel asymmetry can also be clearly seen in the funnel graph, see Figure 2.
Consistent with this interpretation, observe that the largest sample estimates are all quite small. For example, there are only two studies that are adequately powered (power ≥ 80%), when power is computed using UWLS+3 as the estimate of the population mean correlation. These two studies are at the top of the funnel (Figure 2) and have correlations = {−0.06, 0}; thus, the most reliable and informative studies in this area of research find no evidence of a positive correlation between perceived earning potential and women's romantic inclinations. Considerations of power alone make the random-effects estimate dubious.29 Greater resilience to PBS is perhaps HS and UWLS+3's most important property in application. We turn next to simulations that show this to be a general property of both UWLS+3 and HS.
Source: Eastwick et al.33
4. Simulations
To better understand the statistical properties of the meta-analysis of correlations under research conditions commonly seen in psychology, we conduct Monte Carlo simulations. Unlike replications or other empirical analyses, simulations allow us to set and thereby know the exact 'true' (population) value, , of the correlations investigated. To ensure that they reflect typical research conditions found across psychology, we closely calibrate our simulations design to match the key research dimensions found in correlational research. For this purpose, we employ 108 Psychological Bulletin meta-analyses of correlations reported in Stanley et al.4 These 108 meta-analyses jointly contain 5,891 pairs of estimated correlations and their standard errors, from which we can also calculate the sample sizes.
To generate estimated correlations for some variable of interest, , we begin with the regression:
For simplicity, we assume that and that are independently, identically and normally distributed as . In these simulations, , is generated by Equation (16) after random and independent values are generated separately for . Next, the simple, bivariate regression, Equation (16), is estimated, and the t-value of the estimated regression coefficient, , is calculated. 's t-value is then converted to a correlation by Equation (4).
The median sample size is 95, which we round to 100, the 10th percentile uses a sample of 30, and 90th percentile is 424, which we round down to 400 so as not to exaggerate the likely precision of some studies in an area of research. Although a very small percentage of studies use thousands and tens of thousands of observations, to assume larger sample sizes risks underestimating the biases of the majority of meta-analysis of correlations. Recall that related simulation experiments where the sample sizes are fixed but repeatedly doubled reveal how all meta-analyses of correlations have small-sample biases which predictably disappear with larger sample sizes at a rate nearly exactly proportional to 1/df and df = n−2. Using these percentiles as our anchors, we fill in the remainder of the sample size distribution as, n = {30, 40, 50, 75, 100, 100, 125, 160, 200, 400}, to correspond to the sample size distribution observed across these 108 Psychological Bulletin meta-analyses.
Similarly, the values of the population correlation are set to correspond to the observed distribution of random-effects estimates reported in these same 108 meta-analyses. The median absolute value of these 108 REs is 0.232, which, for convenience, we approximate by the sqrt (1/17) = 0.243. The 10th percentile is 0.07, which we "round" up to sqrt (1/82) = 0.110. As shown in previous studies and as confirm below, small values of produce practically no bias unless study results are selected for their statistical significance (i.e., publication selection bias). Thus, we make this small correlation a bit larger, intentionally. The 90th percentile of the RE distribution is 0.422, which we "round" up to sqrt (1/5) = 0.447. The 10th and 90th percentiles reflect a range of values most likely seen in practice. However, as discussed in Section 3.1, all these values are likely an exaggerated reflection of the "true" population mean as RE is widely recognized to be upwardly biased in the presence of PSB, a condition we simulate, corroborate, and discuss further below. Thus, one should focus on the results of the more representative correlation effect sizes, 0.243 and 0.110, or consider the average across all three values of reported in Tables 1 and 2 as "representative."
For each correlational study, all data are generated from Equation (16), this regression is estimated, then r is calculated from Equation (4), is calculated from Equation (2), and from Equation (3). Each of these steps is repeated 50 times to represent one meta-analysis.ix From these 50 randomly generated estimated correlations, RE is calculated using the DerSimonian-Laird estimate of the heterogeneity variance, and both RE and UWLS weighted averages are calculated using both formulas for variance (Table 1). For each of 10,000 randomly generated meta-analysis, RE's and UWLS' biases, square roots of the mean squared errors (RMSE), and coverage rates are calculated. See the Supplement for the simulation code. To investigate whether the use of the "correct" variance, , continues to cause conventional meta-analysis weighted averages to have consistently larger biases than those employing , Table 1 reports the results of these simulations using both versions of r's variance—Equation (2) and Equation (3) for RE and UWLS. Prior studies showed that consistently produces twice the bias as , but it remains an open question whether this result will remain under the above more representative research conditions found in psychology. Table 1 corroborates prior findings that generates larger mean squared errors and inferior coverage (i.e., coverage rates that are often much different than their nominal 95% level).
For Table 2, we use the same simulation design to evaluate the statistical properties of alternative meta-analysis estimators of the mean effect: UWLS+3, HS, and Fisher's z. Table 2 also reports type I error rates, which, by definition, assume that = 0 and then counts how many tests of H0: = 0, reject H0 in the positive direction ( = .05). Table 2 also investigates how well PET-PEESE accommodates PSB; it does surprisingly well.
In the heterogeneity conditions, labeled Het in Tables 1 and 2, we again rely on what was found to be the typical across these 108 meta-analyses, mean = 64.5%. Note that the typical heterogeneity reported in Tables 1 and 2, for the Het case nearly reproduces this level of relative heterogeneity. To do so, we assume that heterogeneity is weakly and inversely correlated with sample size; that is, normally distributed with standard deviations of = {.45, .45, .3, .3, .3, .3, .3, .3, .075, .075} as n = {30, 40, 50, 75, 100, 100, 125, 160, 200, 400}. Meta-research evidence shows that psychology's heterogeneity is inversely correlated with sample size and simulations confirm that these values of heterogeneity produce the level of correlated heterogeneity observed across dozens of psychology meta-analyses.13 To generate random normal heterogeneity, we first convert each estimated correlation to Cohen's d, add a random normal deviation with mean zero and standard deviations {.45, .45, .3, .3, .3, .3, .3, .3, .075, .075} and transform these Cohen's ds back to correlations.x
In the PSB condition, we follow previous studies by assuming that exactly half of the results contained in a meta-analysis have been selected to be statistically significant, while the first random result produced by the other 50% is reported, as it is, statistically significant or not, and included in the meta-analysis.10,12,22,25,37 We do not mean to imply that all areas of psychology have such strong selection for statistical significance. Thus, we also report cases of no selection for statistical significance. Table 2 reports the average statistical results across simulations where there is 50% publication selection bias and where there is no selection for statistical significance. The average across heterogeneity (Het) and 50% PSB (PSB) is likely to better reflect typical areas of psychology, this average is reported in the last row of Table 2, labeled PSB & Het Ave.
The full details of how we generate 500,000 correlation studies from individual subject data, collectively containing 64 million subjects, are reported in the Supplement and found in previous studies.2,17 The central innovations in this paper relative to these recent simulation studies are: (i) the use of a distribution of sample sizes, rather than a single fixed sample size, (ii) the inclusion of heterogeneity typically seen in psychology, (iii) the infusion of 50% PSB, (iv) the investigation of different weighted averages, UWLS+3 and HS (Table 2), (v) the assessment of PET-PEESE for PSB also reported in Table 2, and (vi) a simulation context that follows what is known about actual meta-analyses of correlations in psychology.
5. Results and discussion
Table 1 confirms that the conventional meta-analysis formula of correlations' variance,3 , should not be used in meta-analysis when an obvious and simple alternative is always available, . In all cases, the biases, MSE and CIs are better when is used rather than . Thus, by simply not squaring the numerator of correlation's variance formula, the biases and MSEs of conventional meta-analysis are reduced, and the CIs notably improved. However, when there is no publication bias, the biases of conventional random effects are little more than rounding error ( .01). When there is notable selection for statistical significance (i.e., publication selection bias), the biases of all simple meta-analysis methods can be of scientific and practical consequence (> .05).xi This is especially problematic for more than half of psychological research where effect sizes are small (see the smaller values of = {.11; .243} in the above simulations). The publication bias of RE is especially pernicious when research synthesis is needed most: small correlations. For these, the bias of RE is likely to be as large as the true population correlation or nearly so, and RE is likely to falsely suggest a genuine effect where there is none (see Tables 1 and 2). With notable publication bias, conventional random-effects meta-analyses of 50 correlations are virtually certain to be falsely positive (i.e., to be statistically significant when the correlation is, in fact, zero)—see the type I error rates reported in Table 2.xii
Table 2 reports two further meta-analysis estimators, UWLS+3 and REz, shown by Stanley et al.17 and Stanley et al.,2 respectively, to outperform conventional unadjusted inverse-variance weighted meta-analyses of partial correlations and correlations. To these, we add the HS approach.6,7 Table 2's simulations show that all three of these alternative estimators outperform conventional meta-analyses of correlations (RE) and reduce the small-sample biases to less than rounding error, unless, of course, there is notable publication selection bias. This remains the case even when meta-analyses have a typical distribution of sample sizes and heterogeneity, see the top two thirds of Table 2 and compare them to Table 1. However, as expected, all simple weighted averages, including HS, UWLS+3 and REz can have scientifically notable biases when there is 50% PSB.
There is a long-standing controversy regarding which approach is better: the Hedges–Olkin random-effects of Fisher's z (REz) or the Hunter and Schmidt sample-size weighting of sample correlations (HS). Hunter and Schmidt6 claimed that their method was better than the random-effects conversion to Fisher's z and recommended against the use the Fisher's z transformation. Yet, most applications currently follow Borenstein et al.3 and calculate random-effects of Fisher's z. Several studies have addressed this controversy,38–41 and the more recent ones39,41 generally find that HS is somewhat better. Our simulations find that both UWLS+3 and HS have better statistical properties than REz and thus agree with Hall and Brannick39 and Field.41 However, we also find that the differences are trivial under typical conditions found in the meta-analysis of psychology.
In Section 3.4, above, we discussed PET-PEESE as a method to reduce publication bias in psychology. Several researchers have questioned the validity of PET-PEESE and related meta-regression corrections for publication bias (based on the Egger regression) because SE can be correlated with effect size in the absence of publication bias.35,42,43 Thus, a surprising finding is that, even for correlations, where the correlation with SE in the absence of publication bias is mechanical, PET-PEESE works well to reduce PSB and type I errors when there is publication bias—see the columns associated with PP and PPz in Table 2. Average bias of PP is only about .01 when there is PSB, which is approximately four times smaller than conventional random-effects' biases (using either correlations or Fisher's z transformation). Despite the correlation between SE and in the PET-PEESE meta-regressions, PET-PEESE has relatively excellent statistical properties. Especially relevant, note that PET's type I errors are always within their nominal levels, whether or not there is publication bias. However, PET-PEESE is not perfect and can be improved through the Fisher's z transformation because z is not correlated to its SE. PPz reports the statistical properties of first converting correlations to z, calculating PET-PEESE in terms of Fisher's z, and lastly converting PET-PEESE in terms of z back to a correlation. On average, PPz has smaller bias, MSE, type I errors and better CIs than PP of correlations. However, there is a potential problem with using PPz in the place of PP. PPz is downwardly biased for small correlations (.11), and this is a rather crucial effect size range as Cohen's guidelines suggest that anything less than .1 is "trivial" or "null."28 In contrast, PP is never downwardly bias, and its upward biases are less than rounding error (< .01) for small "true" effect sizes. When analyzing effects that may be null or trivial, it would, therefore, be better to use the untransformed PET-PEESE but to rely on PPz in other cases. For the sake of simplicity, the untransformed PET and its PET-PEESE estimate are always good choices as meta-analysis methods for correlations.
Surprisingly, across the two most representative research conditions, Het and PSB (i.e., heterogeneity without PBS and heterogeneity with 50% PSB, respectively), HS, followed closely by UWLS+3, has the smallest average RMSE. Yet, these simple weighted averages do not correct for PSB, explicitly. Although PET-PEESE does adjust for PSB, the conditional switch between these two models adds a source of variability, hence increasing RMSE. The somewhat smaller RMSEs of HS and UWLS+3 are not justification to employ only these weighted averages when PSB is suspected. All weighted averages have unacceptable Type I errors (>99.6%) with 50% PSB. Because PSB can rarely be ruled out either a priori or though tests of PSB (as they all tend to have low power), PET-PEESE should be routinely reported along with either HS or UWLS+3.
6. Conclusions
Conventional inverse-variance weighted meta-analyses of correlations are biased, even under ideal conditions. However, to isolate and to document these small-sample biases, past studies assumed that all studies in a meta-analysis had the same sample size, no heterogeneity, and no selection for statistical significance (i.e., no PSB).2,17 The purpose of this paper is to investigate the statistical properties of conventional meta-analysis methods under typical conditions widely seen in correlational research in psychology. We find that these small-sample biases remain although they are, for the most part, smaller than rounding error (<.01). Regardless, PSB is the larger threat. Under the typical conditions found among meta-analyses of psychology, the small-sample biases of conventional meta-analysis, alone, are of little consequence (<.01), unless they use the "correct" variance, Equation (3).
This study corroborates prior findings.1,2 The conventional formula for the variance of correlations, , often considered the "correct" variance of correlations,3 should never be used in meta-analysis as it is statistically dominated in all cases by a simpler formula, , that does not square the numerator.
When some results are selected for their statistical significance, PET-PEESE has no notable bias of scientific consequence (< .02), and tests of the correlation's statistical significance (PET) maintain their nominal type I errors. This is an especially surprising finding as estimated correlations are mechanically correlated with their standard errors, though inversely so, in the absence of PSB. This correlation is seen by some to be a disqualifying condition for the application of PET-PEESE and the related Egger regression to meta-analysis.42,43 PET-PEESE is a notable improvement over RE even when averaged across research areas with or without PSB (see the last row of Table 2). With PSB, RE can have biases as large as the population mean correlation it is estimating, and RE is virtually certain (99.9%) to falsely identify statistically significant correlations that do not exist (see Table 2, Type I errors). It is publication selection bias that causes biases of notable scientific and practical consequences, not small-sample biases alone.
We also show that a new simple weighted average, UWLS+3, along with an older but infrequently employed weighted average, HS, statistically dominate RE whether or not correlations are first transformed to Fisher's z (Table 2). This simple correction for small-sample bias, UWLS+3, adjusts the degrees of freedom and emerges as the preferred meta-analysis estimator in the absence of PSB along with HS and Fisher's z. With PSB, PET-PEESE, using either correlations or Fisher's z, has the best statistical properties under typical correlational research conditions. Unless publication selection bias can be ruled out a priori, we recommend researchers report PET-PEESE.
In sum, the central lessons of this study are:
• The small-sample biases of meta-analysis of correlations are rarely more than rounding errors (.01) unless the "correct" variance formula, Equation (3) is used.
• Several simple weighted averages (REz, HS, UWLS+3) provide adequate estimates of the mean effect in the absence of publication bias.
• With publication bias, PET-PEESE is surprisingly effective in spite of SE's mechanical dependence upon the estimated correlation. Thus, PET-PEESE should be reported routinely in a large majority of meta-analyses.
Needless to say, there are limitations to our findings. Our findings apply fully only to the specifications that we simulate, which assume that meta-analyses have the typical conditions seen widely across correlational studies in psychology. However, not all meta-analyses involve "typical" correlational research. In particular, if all studies use small samples (), small-sample biases will generally be larger, and PET-PEESE is no longer valid as there will be too little variation in SE and, as a result, PET-PEESE will produce unreliable estimates.44 When there is little variation in SE, this "independent" (or explanatory) variable in the PET-PEESE meta-regression will have little useful information with which to estimate its regression coefficient. In meta-analyses with little variation in SE, one should not employ PET-PEESE.44,xiii
Although not unique to the methods introduced here, coding errors and other influential data can distort any meta-analysis. To prevent any undue influence from one or a few overly influential effects, meta-analysts should always use influence statistics (also called leverage points or, incorrectly, "outliers") to identify and correct, or remove such overly influential studies regardless of their cause. The criterion and method used to identify leverage points can be stated in a pre-analysis plan. Without the identification and removal of highly influential effect sizes, any meta-analysis result can be highly skewed towards simple coding/transcription/transformation error or, in rare cases, fraud.xiv
In summary, a simple adjustment to degrees of freedom, UWLS+3, along with those weighted averages that depend on sample size alone (Fisher's z and the Hunter and Schmidt approach), will typically eliminate the small-sample biases of the meta-analysis of correlations to something less than rounding error (<.01). However, in practice, the larger problem is frequently publication selection biases. This study finds that PSB is effectively corrected by PET-PEESE under typical conditions seen widely across correlational studies in psychology.
ACKNOWLEDGMENT
Havranek acknowledges support from the Czech Science Foundation (#24-11583S) and from NPO “Systemic Risk Institute” LX22NPO5101, funded by the European Union - Next Generation EU (Czech Ministry of Education, Youth and Sports, NPO: EXCELES).
AUTHOR CONTRIBUTIONS
Conceptualization; Software; Investigation; Formal analysis; Project administration; Writing—original draft; Methodology; Data curation; Validation; Writing—review and editing: T.D.S. Conceptualization; Methodology; Writing—review and editing; Investigation: H.D. Conceptualization; Methodology; Writing—review and editing; Investigation: T.H.
COMPETING INTEREST STATEMENT
The authors declare that no competing interests exist.
DATA AVAILABILITY STATEMENT
The data used in the illustration are available at: https://osf.io/8we4b/.
Codes for the illustration and the simulations are given in the online supplement also at: https://osf.io/8we4b/.
SUPPLEMENTARY MATERIAL
The supplementary material for this article can be found at https://doi.org/10.1017/rsm.2024.5.
REFERENCES
Some entries below were printed without a link. Where a Crossref record matches one and no other record plausibly could, its DOI is shown; ambiguous references are left as they were printed.
- Stanley TD, Doucouliagos H. Correct standard errors can bias meta-analysis. Res Synth Methods. 2023;14: 515–519. 10.1002/jrsm.1631
- Stanley TD, Doucouliagos H, Maier, M, Bartoš F. Correcting bias in the meta-analysis of correlations. Psychol Methods. 2024. https://doi.org/10.1037/met0000662.
- Borenstein M, Hedges LV, Higgins JPT, Rothstein HR. Introduction to Meta-Analysis. John Wiley and Sons; 2009. 10.1002/9780470743386
- Stanley TD, Carter E, Doucouliagos H. What meta-analyses reveal about the replicability of psychological research. Psychol Bul. 2018;144: 1325–1346. 10.1037/bul0000169
- Kvarven A, Strømland E, Johannesson M. Comparing meta-analyses and preregistered multiple-laboratory replication projects. Nat Hum Behav. 2020;4: 659–663. 10.1038/s41562-020-0864-3
- Hunter JE, Schmidt FL. Methods of Meta-Analysis: Correcting Error and Bias in Research Findings. Sage; 1990.
- Schmidt FL, Hunter JE. Methods of Meta-Analysis: Correcting Error and Bias in Research Findings. Sage; 2015. 10.4135/9781483398105
- Gustafson RL. Partial correlations in regression computations. JASA. 1961;56(294): 363–367.
- Fisher RA. On the probable error of a coefficient of correlation deduced from a small sample. Metron. 1921; 1: 3–32.
- Stanley TD, Doucouliagos H. Neither fixed nor random: Weighted least squares meta-analysis. Stat Med. 2015; 34: 2116e27. 10.1002/sim.6481
- Stanley TD, Doucouliagos H. Neither fixed nor random: Weighted least squares meta-regression analysis. Res Synth Methods. 2017; 8: 19–42. 10.1002/jrsm.1211
- Stanley TD, Doucouliagos H, Ioannidis JPA. Finding the power to reduce publication bias, Stat Med. 2017;36: 1580–1598. 10.1002/sim.7228
- Stanley TD, Doucouliagos H, Ioannidis JPA. Beyond random effects: When small-study findings are more heterogeneous. AMPPS. 2022;5: 1–11.
- Stanley TD, Ioannidis JPA, Maier, M, Doucouliagos H., Otte WM, Bartoš F. Unrestricted weighted least squares represent medical research better than random effects in 67,308 Cochrane meta-analyses. J Clin Epidemiol. 2023;157: 53–58.
- Greene WH. Econometric Analysis. Macmillan; 2003.
- Davidson R, MacKinnon JG. Econometric Theory and Methods. Oxford University Press; 2004.
- Stanley TD, Doucouliagos H, Havránek T. Meta-analyses of partial correlations are biased: Detection and solution. Res Synth Methods. 2024. https://onlinelibrary.wiley.com/doi/10.1002/jrsm.1704.
- Fisher, RA . The distribution of the partial correlation coefficient, Metron. 1924;3: 329–332.
- Olkin I, Pratt J W. Unbiased estimation of certain correlation coefficients. Ann Math Stat. 1958;29: 201–211. 10.1214/aoms/1177706717
- Field AP. Meta-analysis of correlation coefficients: A Monte Carlo comparison of fixed- and random-effects methods. Psychol Methods. 2001;6: 161–180. 10.1037/1082-989x.6.2.161
- Klein RA, Vianello M, Hasselman F, Alper S, Aveyard M, Axt JR, Nosek BA. Many Labs 2: Investigating variation in replicability across sample and setting. AMPPS. 2018;1(4): 443–490.
- Bartoš F, Maier M, Wagenmakers EJ, Doucouliagos H, Stanley TD. Robust Bayesian meta-analysis: Model averaging across complementary publication bias adjustment methods. Res Synth Methods. 2023;14: 99–116. 10.1002/jrsm.1594
- Bartoš F, Maier M, Shanks DR, Stanley TD, Sladekova M, Wagenmakers EJ. Meta-analyses in psychology often overestimate evidence for and size of effects. R Soc Open Sci. 2023. https://doi.org/10.1098/rsos.230224.
- Carter EC, Schonbrodt FD, Gervais WM, Hilgard J. Correcting for bias in psychology: A comparison of meta-analytic methods. AMPPS. 2019;2(2): 115e44.
- Stanley TD and Doucouliagos H. Meta-regression approximations to reduce publication selection bias. Res Synth Methods. 2014;5: 60–78. 10.1002/jrsm.1095
- Carter EC, Kofler LE, Forster DF, McCullough ME. A series of meta-analytic tests of the depletion effect: Self-control does not seem to rely on a limited resource. J Exp Psychol Gen. 2015;144: 796–715. 10.1037/xge0000083
- Hagger MS, Chatzisarantis NLD, Alberts H, et al. A multi-lab preregistered replication of the ego-depletion effect. Perspect Psychol Sci. 2016;11: 546–573.
- Cohen J. Things I learned (so far). Am Psychol. 1990;4(5): 1304–1312. 10.1037/0003-066x.45.12.1304
- Stanley TD, Doucouliagos H, Ioannidis JPA. Retrospective median power, false positive meta-analysis and large-scale replication. Res Synth Methods, 2022;13: 88–108. 10.1002/jrsm.1529
- Stanley TD, Doucouliagos H. Harnessing the power of excess statistical significance: Weighted and iterative least squares. Psychol Methods. 2022. Advance online publication. https://doi.org/10.1037/met0000502
- Stanley TD. Beyond publication bias. J Econ Surv. 2005;19: 309–345. 10.1111/j.0950-0804.2005.00250.x
- Irsova Z, Bom PRD, Havranek T, Rachinger H. Spurious precision in meta-analysis. MetaArXiv. 2023; February 23. https://doi.org/10.31222/osf.io/3qp2w.
- Eastwick PW, Luchies LB, Finkel EJ, Hunt ll. The predictive validity of ideal partner preferences: A review and meta-analysis. Psychol Bull. 2014;140: 623–665. 10.1037/a0032432
- Cohen J. Statistical Power Analysis for the Behavioral Sciences. 2nd ed . Academic Press; 1988.
- Egger M, Smith GD, Schneider M, Minder C. Bias in meta-analysis detected by a simple, graphical test. BMJ. 1997;315: 629–634. 10.1136/bmj.315.7109.629
- Doucouliagos C(H) and Stanley TD. Theory competition and selectivity: Are all economic facts greatly exaggerated? J Econ Surv. 2013;27: 316–339. 10.1111/j.1467-6419.2011.00706.x
- Bom PRD, Rachinger H. A kinked meta-regression model for publication bias correction. Res SynthMethods. 2019;10: 497e514. 10.1002/jrsm.1352
- Silver NC and Dunlap WP. Average correlation coefficients: Should Fisher's Z transformation be used? J Appl Psychol 1987;72: 146–148. 10.1037/0021-9010.72.1.146
- Hall, S. M., Brannick, M. T. Comparison of two random-effects methods of meta-analysis. J Appl Psychol 2002;87: 377–389.
- Field, A. Meta-analysis of correlation coefficients: A Monte Carlo comparison of fixed- and random-effects models. Psychol Methods, 2001;6 : 161–180. 10.1037/1082-989x.6.2.161
- Field, A. Is the meta-analysis of correlation coefficients accurate when population correlations vary? Psychol Methods. 2005;10: 444–446 10.1037/1082-989x.10.4.444
- Moreno SG, Sutton AJ, Ades AE, et al. Assessment of regression-based methods to adjust for publication bias through a comprehensive simulation study. BMC Med Res Methodol. 2009; 9:2. 10.1186/1471-2288-9-2
- Pustejovsky JE, Rodgers MA. Testing for funnel plot asymmetry of standardized mean differences. Res Synth Methods. 2019;10: 57–71. 10.1002/jrsm.1332
- Stanley TD. Limitations of PET-PEESE and other meta-analysis methods. Soc Psychol Pers Sci. 2017; 8: 581–591. 10.1177/1948550617693062
- Bartoš F, Maier M, Wagenmakers EJ, Nippold F, Doucouliagos H, Ioannidis JPA, Otte WM, Sladekova M, Fanelli D, Stanley TD. Footprint of publication selection bias on meta-analyses in medicine, environmental sciences, psychology, and economics. Res. Synth Methods. 2024 https://onlinelibrary.wiley.com/doi/pdf/10.1002/jrsm.1703.
- Kivikangas JM, Fernández-Castilla B, Järvelä S, Ravaja N, Lönnqvist J-E. Moral foundations and political orientation: Systematic review and meta-analysis. Psychol Bull. 2021;147(1): 55–94. https://doi.org/10.1037/bul0000308
- Graham J, Nosek BA, Haidt J, Iyer R, Koleva S, Ditto PH. Mapping the moral domain. J Pers Soc Psychol. 2011;101(2): 366–385. 10.1037/a0021847
ENDNOTES
- It should be noted that Fisher's z transformation is not the same as the z-values, widely used throughout statistics and meta-analysis to represent the normal distribution.
- Figure 1 is not meant to imply that RE biases are larger than UWLS's for the same variance formula and sample size. In fact, the contrary is true.17 Rather, Figure 1 is offered merely to show compactly and clearly that these biases are a near perfect function of the inverse degrees of freedom; hence, they must be small-sample biases.
- We thank an anonymous reviewer and the associate editor for suggesting the Hunter and Schmidt approach.
- Correlations are converted to z by: , and Fisher's z is transformed back to correlations by: .
- Only the precision-effect test (PET) provides a valid test (H0: = 0, from Equation (12) for the presence of a nonzero mean effect, after correcting for potential PSB.
- Both WAAP and WILS calculate UWLS on a subset of the effect sizes. WAAP uses only those studies that have 80% or higher statistical power, while WILS first removes those estimates most responsible for excess statistical significance.
- Because these intercepts are in the opposite direction of the meta-analysis estimates (i.e., negative), we interpret them as negligible. When the PET estimate is of the opposite sign as UWLS, PEESE, Equation (13), should not be calculated. In these cases, there is such a strong correlation with the standard error that any statistical evidence of a mean effect is erased once potential PSB in accommodated. PEESE should be employed only if there is some evidence of an effect in the predominant direction.
- Note that the magnitude of the estimated FAT coefficients, 1.94, is quite substantial. When, the FAT coefficient is two or larger, Doucouliagos and Stanley36 categorize this as "severe" publication selection because it implies that the average effect size is exaggerated by twice its SEs; just sufficient to make a null effect appear statistically significant. The SE of Fisher's z does not depend on the magnitude of the correlation (or Fz); thus, this clear positive correlation with SE cannot be dismissed as a statistical artifact of its variance formula. Nor can the fact that the formula for depends on be used to dismiss its positive correlation, Equation (14), as this formula embeds a slight negative correlation.
- In psychology, the average number of estimated correlations per meta-analysis is 55.4 The biases of correlations are largely independent of the number of correlations () meta-analyzed. In contrast, the sample size () of the primary study used to calculate correlations is a very important determinant of this bias, as meta-analysis of correlations suffers from small-sample bias.2 In these simulations, we assume that the distribution of sample sizes reflects what is typically seen in psychology.
- Random heterogeneity added to produce asymmetric, nonnormal, sampling distributions that induce further estimation biases. Conversion to Cohen's d avoids this added source of bias. Generating heterogeneity through random variations to 's regression coefficient, , Equation (16), produces approximately the same overall results.
- The threshold for scientific or practical significance of a given bias would depend on what is a notable difference for the specific application in question. Here, we consider .05 to be a bias of potential scientific consequence as a null correlation < .1, according to Cohen's guidelines, could easily double and become what most psychologists regard as "small" and nonnull.28,34
- Table 2 reports that the type I error of the random effects estimates that are based on the z-transformation, REz, to be 99.85%. In all cases, REz has better statistical properties than the conventional RE of correlations. Compare RE2 in Table 1 to REz in Table 2.
- However, it needs to be emphasized that meta-analyses in psychology typically have sufficient variation in sample size and SE to allow the PET-PEESE models to be reliably estimated. Across 596 psychology meta-analyses, the typical (median) ratio between the smallest sample size and the largest is a factor of 20.41–45 Thus, the typical distribution of sample sizes across psychology is wider than the distribution of sample sizes used in this paper's simulations. In those rare cases where there is little variation among samples sizes (e.g., , for all studies), we recommend Bayesian model averaging that lets the research record, itself, decide on the appropriate weights.22
- An illustrative example comes from Kivikangas' et al.46 meta-analysis of the correlation between moral foundations and political orientation. In this area of research, one study stands out, Graham et al.47 It uses an online survey, YourMorals.org, requiring the volition of over 200,000 individual subjects. Including this one study doubles the mean effect size, as Graham et al.47 reports both the largest correlations and the largest sample by more than an order of magnitude. This study's large effect size is probably not an error and clearly is not fraud. As Kivikangas et al.46 argue, the large effect was likely the result of self-selection to participate by those with the more extreme political orientations. Regardless of cause, such overly influential studies need to be omitted or accommodated through moderator analysis, just as Kivikangas et al.46 did.