Candidates for the worked example on How to run MAIVE. Every funnel below is the plot EasyMeta returns for that subset, under the same recipe the page teaches: PET-PEESE, log first stage, equal weights, CR2 clustered by study.
Winsorisation is applied to the data here, not passed as a setting: the shipped CSV is what was analysed. That matters because the MAIVE R package has no winsorisation argument, so a run that used the app's own setting could not be reproduced in R, while these can: the R code on the how-to page returns these numbers from these files.
What a good example needs, and why these were hard to find. The estimates have to be spread no wider than their own standard errors, or the cloud is a flat band instead of a triangle. The sample sizes have to vary a lot, or MAIVE's fitted standard errors, the filled points, collapse into a horizontal line. The first stage has to be strong. And there has to be real asymmetry to correct. Those pull against each other: the subsets homogeneous enough to look like a funnel tend to have too little variation in sample size to identify anything.
1. Hedge-fund alpha, annual, no backfill correction
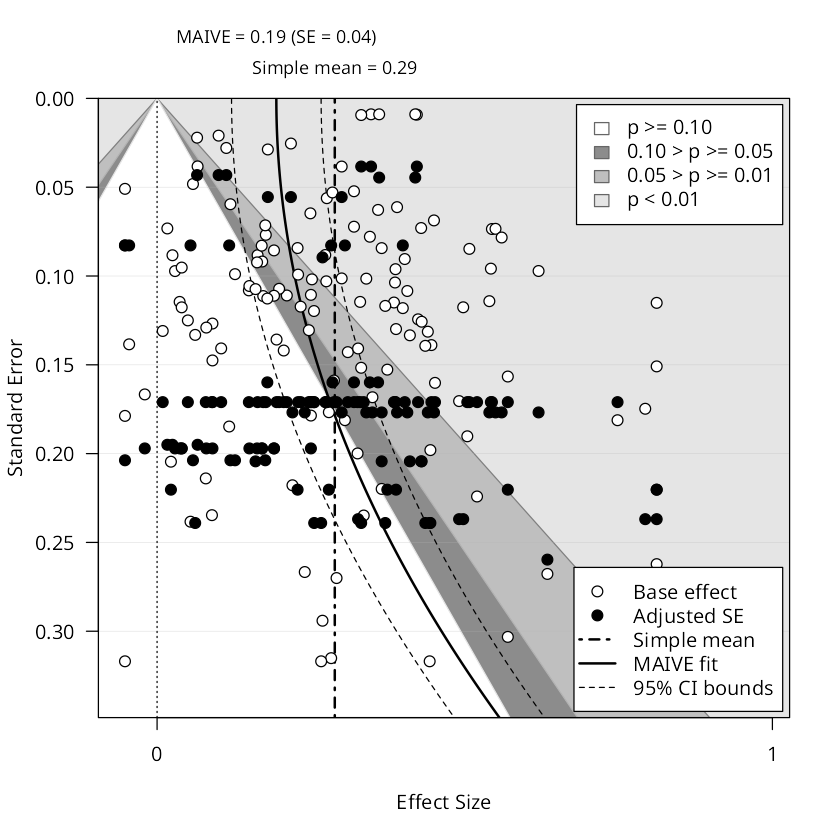
Alphas reported at annual rather than monthly frequency, from studies that do not correct for backfilling bias -- the tendency of funds to enter a database with their good early years already in it. 2% winsorisation.
| Simple mean | 0.29 |
|---|---|
| MAIVE | 0.194 (SE 0.037) |
| First-stage F | 146.6 |
| Fit | PEESE |
| Bias test (Egger p) | 0.065 not significant |
| Estimates / studies | 133 from 9 |
alphas: alpha_monthly == 0 and backfilling_treated == 0, winsorised at 2% ·
the exact CSV
The closest to everything asked for. The PET-PEESE rule selects PEESE, so the fit is the curve rather than the straight line; the first stage is the strongest of any candidate at F = 147; and the Hausman test rejects at 9.1 against 3.84, which is the test that says instrumenting the standard errors changes the answer. The reported mean of 0.29% per month falls to 0.19%. Two caveats: the Egger test is 0.065, just outside conventional significance, and the fitted standard errors still form visible horizontal bands because sample sizes repeat across estimates.
2. Hedge-fund alpha, asset-based-style models
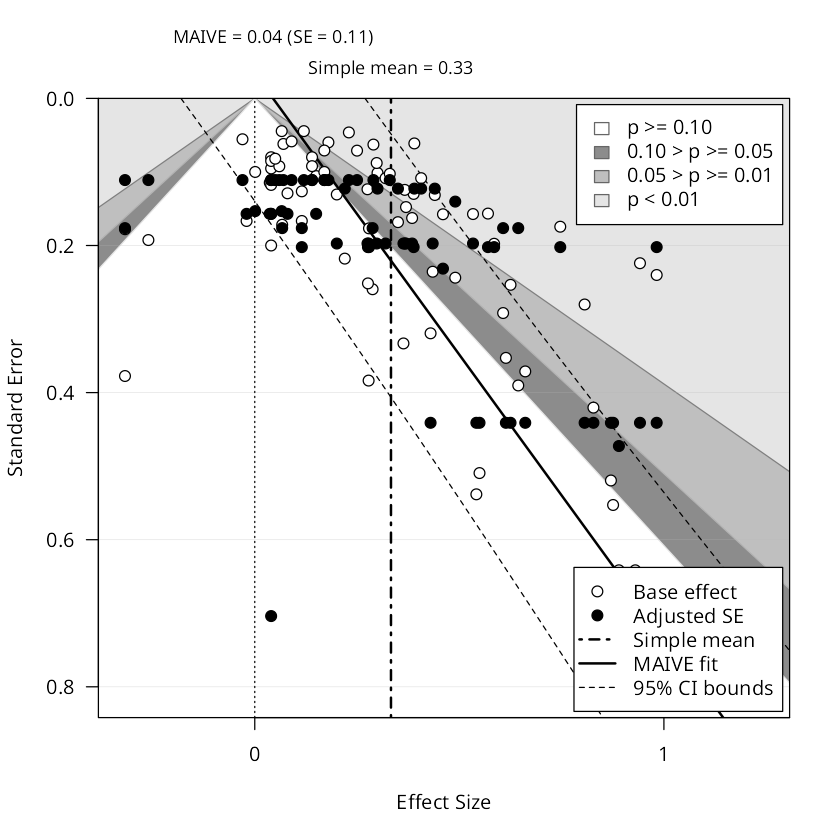
Alphas from asset-based-style pricing models on cross-sectional samples -- the corner of the literature where alpha is measured against a benchmark you can actually trade. 2% winsorisation.
| Simple mean | 0.33 |
|---|---|
| MAIVE | 0.045 (SE 0.115) |
| First-stage F | 59.7 |
| Fit | PET |
| Bias test (Egger p) | 0.012 |
| Estimates / studies | 75 from 9 |
alphas: model_asset_based == 1 and data_cross_section == 1, winsorised at 2% ·
the exact CSV
The only candidate whose bias test clearly rejects once standard errors are clustered by study (p = 0.012), and the correction is the largest of the three: 0.33% per month reported, 0.04% after MAIVE -- the difference between an alpha and none. The funnel is clean and sparse. Against it: the fit is a straight PET line, and the Hausman test does not reject.
3. ESG and board gender diversity, emerging markets
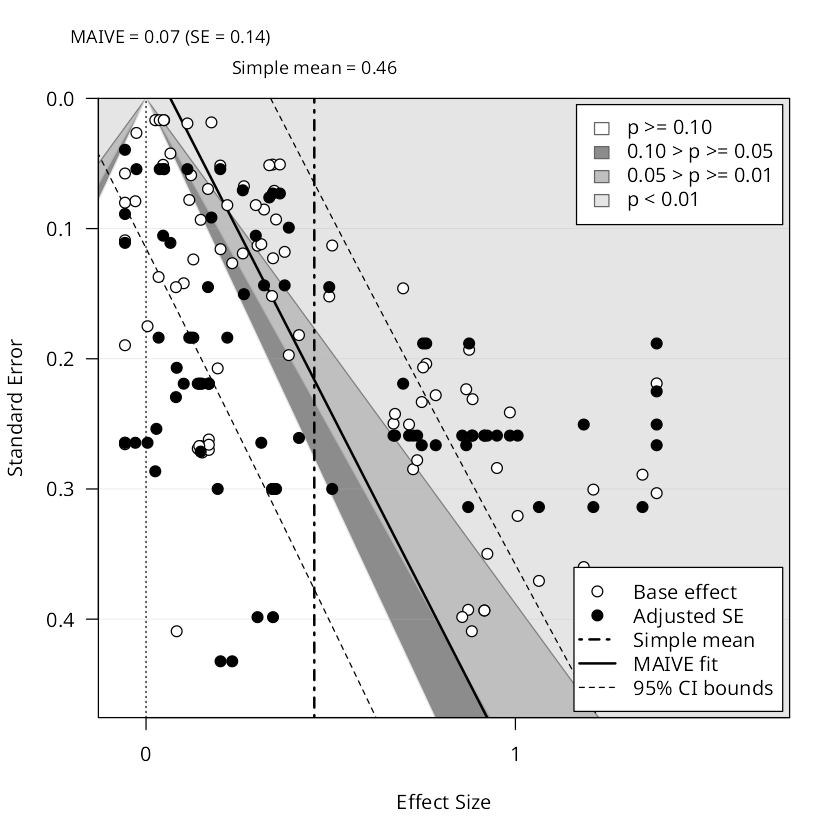
Estimates for firms in emerging markets, from studies that control for firm size. 5% winsorisation.
| Simple mean | 0.46 |
|---|---|
| MAIVE | 0.066 (SE 0.139) |
| First-stage F | 16.9 |
| Fit | PET |
| Bias test (Egger p) | 0.047 |
| Estimates / studies | 87 from 23 |
esg: emerging == 1 and control_firm_size == 1, winsorised at 5% ·
the exact CSV
Keeps the ESG numbers, and now has a shape: 87 estimates spread across the axis with a clear rightward lean, a reported mean of 0.46 falling to 0.07, and a bias test that rejects at 0.047. The fit is a straight line.
Numbers fetched live on 2026-08-24. This page is a workbench: it is not linked from the site and is excluded from the search index and the sitemap.