Meta-analyses of partial correlations are biased: Detection and solutions
T. D. Stanley, Hristos Doucouliagos, and Tomas Havranek (2024): "Meta-analyses of partial correlations are biased: Detection and solutions." Research Synthesis Methods 15(2): 313-325. https://doi.org/10.1002/jrsm.1704.
T. D. Stanley1,2 | Hristos Doucouliagos1 | Tomas Havranek2,3,4
1Department of Economics, Deakin University, Burwood, Victoria, Australia
2Meta-Research Innovation Center at Stanford, Stanford University, Palo Alto, USA
3Institute of Economic Studies, Faculty of Social Sciences, Charles University, Prague, Czech Republic
4Centre for Economic Policy Research, London, UK
Correspondence T. D. Stanley, Department of Economics, Deakin University, 221 Burwood Highway, Burwood, Victoria 3125, Australia. Email: stanley@hendrix.edu
Funding information Czech Science Foundation, Grant/Award Number: #24-11583S; NPO "Systemic Risk Institute", Grant/Award Number: LX22NPO5101; European Union—Next Generation EU
Abstract
We demonstrate that all meta-analyses of partial correlations are biased, and yet hundreds of meta-analyses of partial correlation coefficients (PCCs) are conducted each year widely across economics, business, education, psychology, and medical research. To address these biases, we offer a new weighted average, . is the unrestricted weighted least squares weighted average that makes an adjustment to the degrees of freedom that are used to calculate partial correlations and, by doing so, renders trivial any remaining meta-analysis bias. Our simulations also reveal that these meta-analysis biases are small-sample biases , and a simple correction factor of greatly reduces these small-sample biases along with Fisher's z. In many applications where primary studies typically have hundreds or more observations, partial correlations can be meta-analyzed in standard ways with only negligible bias. However, in other fields in the social and the medical sciences that are dominated by small samples, these meta-analysis biases are easily avoidable by our proposed methods.
Keywords: bias, meta-analysis, partial correlation coefficients, small sample
Highlights
What is already known
— All meta-analyses of partial correlation coefficients (PCCs) are biased, though the biases are relatively small in most cases.
— Hundreds of meta-analyses of PCCs are conducted each year.
What is new
— We offer two new corrections, and , that widely reduce these biases to scientific negligibility.
— Fisher's z transformations also produce small-sample biases, although they are generally negligible in application.
— is the unrestricted weighted least squares weighted average that adjusts the degrees of freedom. It is generally less bias than meta-analyses that transform PCCs to Fisher's z.
Potential impact for Research Synthesis Methods readers
— These new methods apply widely to all disciplines where one wishes to conduct a systematic review of the findings from multiple regressions.
1 | INTRODUCTION
Hundreds of meta-analyses of partial correlation coefficients (PCCs) are conducted each year widely across economics, business, education, psychology, and medical research.i Some researchers consider partial correlations to be the preferred effect size to summarize multiple regressions.1 Others recommend using partial correlations as a last resort when different measures of the dependent variable and/or the independent variable of interest are routinely employed in the relevant area of research.2
It is widely known that individual correlation estimates, and PCCs, are biased downward (e.g., Olkin and Pratt).3 Recently, Stanley and Doucouliagos uncover the counterintuitive result that all meta-analyses of PCC are, in contrast, biased upward.4 That is, all meta-analyses of PCCs are biased regardless of whether fixed effect (FE), random effects (RE), or the unrestricted weighted least squares (UWLS) weighted average are employed and in the absence of any publication selection bias.ii In this paper, we offer novel small-sample corrections that render any remaining meta-analysis biases of PCCs scientifically trivial.
2 | PARTIAL CORRELATION COEFFICIENTS
Across many disciplines, multiple regressions are employed to evaluate the effect of a treatment, condition, or variable upon some outcome of interest after controlling for other, potential contaminating, effects or obscuring complexities. Multiple regression can be represented as:
where is the dependent variable or outcome of interest. Without loss of generalization, we take as the primary variable of interest (perhaps a dichotomous variable representing treatment). The other Xs are independent variables that are thought to affect the outcome. Subscript i represents an individual observation in a primary study (a consumer, an individual subject, a geographical region, etc.), j is the total number of independent variables, and represent sampling errors and other residuals.
Multiple regression is used with observational data, quasi-experiments, and experimental designs when additional experimental conditions or pre-treatment subject characteristics need to be considered. For our purposes, the strength of the experimental design is not relevant as long as the focus of the meta-analysis is upon the estimated multiple regression coefficient, , across the research literature. However, in some cases, observational multiple regressions can offer strong research designs.5
The partial regression coefficient, , is not a standardized effect. It is measured in units of per a one unit increase in . Any change in the measure, metric, or scale of either or from one study to the next will render the respective estimates of uncomparable. PCCs solve this problem. PCCs have the same statistical properties and interpretation as simple bivariate correlations after the effects of have been eliminated.6 Simple bivariate Pearson correlations are often employed as effect sizes in meta-analysis, and partial correlations come with the same advantages and limitations.
Gustafson mathematically derived a convenient formula that converts any partial regression coefficient, , into a PCC, :
where is the conventional t-test for the statistical significance of in the explanation of , and are the degrees of freedom available to the multiple regression, Equation (1).7 can be interpreted as a standardized regression coefficient that estimates the number of standard deviations that increases when increases by a one standard deviation, holding all other variables constant, and is the proportion of the variation in attributable to variation in after eliminating the effects of . Because economics, business, and social sciences, in general, often use different scales and measures for and/or , PCCs are frequently employed in the meta-analysis of these fields.2,8,9
The variance of is:
as derived in Olkin and Siotani.1,10,11
However, the test of PCC's statistical significance, , requires a slightly different formula for the variance of :
where is the population PCC.11,12 Otherwise, the test of statistical significance of the partial correlation would give an illogical and different result than the test of the statistical significance of the partial regression coefficient from which this PCC is derived.2 Levy and Narula show that the more complex variance formula, , reduces to when .11,12 These two formulae for 's variance only differ in that the numerator of is not squared. Since, by definition, , it follows that for all {0 or 1}. Using and reproduces the t-value and the p-value of the original estimated partial regression coefficient, ; does not.
Below we demonstrate that all meta-analyses of PCCs are biased (including FE, RE, and UWLS) regardless of which formula of variance is used. Nevertheless, conventional meta-analyses that use cause the estimates of mean effect to be twice as biased as those which employ . To address these biases, we offer a simple modification to the transformation formula, Equation (2), and a second small-sample bias correction for degrees of freedom. First, however, we establish and discuss the bias of the conventional meta-analysis of PCCs. It is only through understanding these biases that a solution can be found.
3 | META-ANALYSIS BIAS
3.1 | Simulations
To investigate the statistical properties of the meta-analysis of partial correlations, we conduct Monte Carlo simulations of RE and UWLS estimates of the mean PCC from randomly generated data, which is used to estimate multiple regressions and transform each to a PCC. Simulations offer an important advantage over other approaches in that we can set the "true" population value of the PCC, , by forcing its value upon the data generating process.
To obtain estimated PCCs for the effect size corresponding to the variable, , we start with the following multiple regression:
where n is set at {25, 50, 100, 200, and 400} but held constant for a given simulation to identify and understand the resulting small-sample biases. For simplicity, we set all betas to 1 and assume that , , and are independently and identically distributed as .iii The variable, , is generated by Equation (5) after random and independent values are generated for , , and . As a next step, we estimate a multiple regression for Equation (5) and calculate the t-value of the estimated regression coefficient . We then convert t-value to a PCC via Equation (2).
Due to the clarity and simplicity of these data generating processes, the population variance of not attributed to the remaining independent variables, , equals 2 because this variance can be computed as the sum of the variances of and , each of which is set to have variance 1. Both and are independently distributed with variance 1; hence, this total variance is the sum of and variances. Thus, the ratio of remaining variance explained by is , leading to or 0.707107. This result also follows from Gustafson where is shown to be: .5 Recall that is set to 1, ,13 and both and are set to 1 by design; thus, again . In other simulation experiments, we set equal to a "medium" effect size by dividing randomly generated by 3 and a "small" effect size by dividing by 9. Doing so makes variance equal to 1/9 and 1/81, respectively while leaving the error variance at 1—see Table 1.
For each study in our simulations, all the data in Equation (5) is randomly generated, the multiple regression, Equation (5), and its coefficients are estimated, and is calculated from Equation (2). is then calculated from Equation (3) and from Equation (4), and all these calculations are repeated 50 times to represent one meta-analysis.iv For each meta-analysis of 50 estimated PCCs, the RE and the UWLS weighted averages are calculated in two ways by using and .
| Design | n | Bias RE1 | Bias RE2 | Bias UWLS1 | Bias UWLS2 | RMSE RE1 | RMSE RE2 | RMSE UWLS1 | RMSE UWLS2 | Coverage RE1 | Coverage RE2 | Coverage UWLS1 | Coverage UWLS2 |
|---|---|---|---|---|---|---|---|---|---|---|---|---|---|
| 0.7071 | 25 | 0.0455 | 0.0233 | 0.0540 | 0.0233 | 0.0478 | 0.0278 | 0.0568 | 0.0278 | 0.1428 | 0.8521 | 0.0588 | 0.3787 |
| 0.7071 | 50 | 0.0223 | 0.0108 | 0.0254 | 0.0108 | 0.0245 | 0.0149 | 0.0277 | 0.0149 | 0.4103 | 0.9497 | 0.2954 | 0.5928 |
| 0.7071 | 100 | 0.0111 | 0.0053 | 0.0125 | 0.0053 | 0.0131 | 0.0088 | 0.0145 | 0.0088 | 0.6619 | 0.9796 | 0.5788 | 0.7136 |
| 0.7071 | 200 | 0.0055 | 0.0026 | 0.0061 | 0.0026 | 0.0075 | 0.0057 | 0.0080 | 0.0057 | 0.8109 | 0.9878 | 0.7714 | 0.7734 |
| 0.7071 | 400 | 0.0028 | 0.0013 | 0.0031 | 0.0013 | 0.0045 | 0.0038 | 0.0048 | 0.0038 | 0.8824 | 0.9911 | 0.8585 | 0.8025 |
| 0.3162 | 25 | 0.0347 | 0.0173 | 0.0490 | 0.0194 | 0.0461 | 0.0336 | 0.0591 | 0.0348 | 0.7358 | 0.8987 | 0.5843 | 0.8312 |
| 0.3162 | 50 | 0.0179 | 0.0083 | 0.0216 | 0.0089 | 0.0265 | 0.0208 | 0.0295 | 0.0211 | 0.8327 | 0.9329 | 0.7810 | 0.8900 |
| 0.3162 | 100 | 0.0091 | 0.0042 | 0.0104 | 0.0045 | 0.0161 | 0.0138 | 0.0170 | 0.0139 | 0.8892 | 0.9469 | 0.8714 | 0.9118 |
| 0.3162 | 200 | 0.0045 | 0.0020 | 0.0050 | 0.0022 | 0.0102 | 0.0093 | 0.0105 | 0.0093 | 0.9246 | 0.9612 | 0.9127 | 0.9278 |
| 0.3162 | 400 | 0.0022 | 0.0009 | 0.0024 | 0.0010 | 0.0068 | 0.0065 | 0.0069 | 0.0065 | 0.9424 | 0.9599 | 0.9339 | 0.9349 |
| 0.1104 | 25 | 0.0134 | 0.0065 | 0.0198 | 0.0079 | 0.0360 | 0.0321 | 0.0412 | 0.0328 | 0.9114 | 0.9413 | 0.8771 | 0.9234 |
| 0.1104 | 50 | 0.0073 | 0.0034 | 0.0088 | 0.0039 | 0.0225 | 0.0208 | 0.0234 | 0.0210 | 0.9332 | 0.9517 | 0.9246 | 0.9410 |
| 0.1104 | 100 | 0.0034 | 0.0015 | 0.0040 | 0.0017 | 0.0150 | 0.0144 | 0.0152 | 0.0145 | 0.9431 | 0.9532 | 0.9362 | 0.9430 |
| 0.1104 | 200 | 0.0017 | 0.0007 | 0.0019 | 0.0008 | 0.0102 | 0.0100 | 0.0103 | 0.0100 | 0.9495 | 0.9548 | 0.9424 | 0.9468 |
| 0.1104 | 400 | 0.0009 | 0.0005 | 0.0010 | 0.0005 | 0.0071 | 0.0070 | 0.0071 | 0.0070 | 0.9596 | 0.9623 | 0.9533 | 0.9535 |
| Average | 0.0122 | 0.0059 | 0.0150 | 0.0063 | 0.0196 | 0.0153 | 0.0221 | 0.0155 | 0.7953 | 0.9482 | 0.7520 | 0.8310 |
Note: is the "true" population mean partial correlation coefficient (PCC). n is the sample size used in the primary study's multiple regression. Bias is the difference between the meta-analysis estimate and calculated from 50 estimated partial correlation coefficients and averaged across 10,000 replications. RMSE is the square root of the mean squared error. Coverage is the proportion of 10,000 meta-analyses' 95% confidence intervals that contain . RE is the random-effect's estimate of the mean, and UWLS is the unrestricted weighted least squares' estimate of the mean. The subscripts (1 and 2) refer to the use of either the PCC variance, , from Equation (3) or from Equation (4) to calculate the RE and UWLS weighted averages.
UWLS estimates the simple meta-regression coefficient, , from:
where is the number of PCCs combined into the meta-analysis. is often called the number of studies. In the supplement, we also report the results for the simulation designs that correspond to Tables 2 and 4 but with {10; 200} to ensure robustness. is calculated as the square root of either or from their respective formulae above. Any common statistical software automatically calculates UWLS, , its standard error, test statistic, and confidence intervals. UWLS and the FE must have identical point estimates, but UWLS automatically adjusts its standard errors and confidence intervals for heterogeneity when present.14,15 We do not assume a common effect but instead allow for random, additive heterogeneity (Section 3.3, below); thus, FE is not an appropriate model for these simulations. Previous simulations have shown that UWLS is statistically superior to RE if there is selection for statistical significance or if small studies are more heterogeneous than larger studies.14,16 In other cases where RE's model is imposed upon the simulations, the differences between UWLS' and RE's statistical properties are negligible. For each randomly generated meta-analysis, the bias, RMSE (square root of the mean squared error), and coverage rates of RE and UWLS are calculated and then averaged across 10,000 replications of all these steps. See the Supplement for the simulation code.
Table 1 reports the results of these simulations using both versions of PCC's variance—Equation (3) and Equation (4). Using either RE or UWLS with consistently produces biases only 50% as large as the conventional approach, RE with , on average and for most of the individual conditions. Table 1 also shows that generates larger root mean squared errors and worse coverage (i.e., coverage rates that are often much different than their nominal 95% level) than . In Section 3.2, below, we discuss the reason for these biases and why produces predictably larger biases. These results confirm Stanley and Doucouliagos' finding that the theoretically "correct" variance, , Equation (3), is not useful in practice when conducting meta-analyses of partial correlations.4
3.2 | Reducing meta-analysis bias to triviality
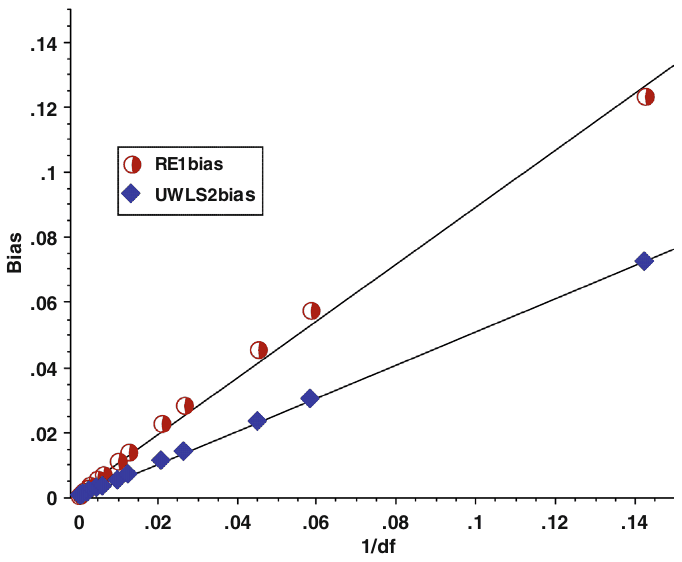
Looking closely at the biases identified through simulations reveals two additional lessons. First, although these biases are of a notable magnitude for small samples , all these biases are mere rounding errors (i.e., ) or smaller for large samples (i.e., or if is used). Second, biases consistently halve as doubles. Figure 1 graphs RE's and UWLS' biases against the inverse of degrees of freedom when , using 10,000 replications of each sample size, {10, 20, 40, 80, 160, 320, 640, 1280 and 25, 50, 100, 200, 400, 800, 1600, 2500}. Figure 1 reveals that approximately halves RE's bias and that doubling the sample size of the original study halves the bias of each again.
To be more precise, the biases of UWLS with inverse weights are a near exact function of the inverse of degrees of freedom :
The values in parentheses are the t-values for the estimated regression intercept and slope coefficients, respectively; values greater than 2.145 are statistically significant at the 0.05 level (t-values with ). The inverse of degrees of freedom, , explains over 99.99% of the bias of UWLS leaving a 95% margin of error of 0.0003. Through numerical analysis, we know that the bias of the meta-analysis of PCCs is a function of the inverse df, and that any remaining error is negligible.
A century ago, Fisher observed that the: "sampling distribution of the partial correlation obtained from n pairs of values, when one variable is eliminated, is the same as the random sampling distribution of a total correlation derived from pairs. By mere repetition of the above reasoning, it appears that when variates are eliminated the effective size of the sample is diminished to " (p. 330).6 This suggests that fine-tuning the degrees of freedom in PCC's transformation formula may substantially reduce or practically eliminate this bias. Further simulations confirm that this is indeed the case.
3.2.1 | Reducing meta-analysis of PCCs bias to triviality: REss
Following Fisher's observation, consider the simple bivariate correlation:
The sample covariance, , has degrees of freedom , because two parameters, and , must be first estimated from a sample of pairs of observations. Each sample variance, and , has has degrees of freedom; thus, the denominator is . This suggests that a correction for degrees of freedom, , might reduce the small-sample bias of meta-analysis weighted averages that is revealed in Table 1. When the small-sample bias is proportional to and multiplying by should reduce or correct this small-sample bias. Table 2 reports the random-effects, small-sample correction, , where each sample PCC is first multiplied by before the usual random-effects formulae are applied using from Equation (4). greatly reduces the small-sample biases—compare Tables 1 and 2.
These small-sample corrections of PCCs, however, should not be applied to individual stand-alone PCCs because it is widely known that individual correlation estimates, and PCCs, are biased downward.3 Applying this small-sample adjustment to stand-alone PCCs would then only make a small downward bias worse. Rather, they should be used only as an intermediate step in the calculations of meta-analysis weighted averages of PCCs. We propose employing these small-sample corrections, and (see below) only in the calculations of meta-analysis weighted averages of PCCs. When applied to UWLS this small-sample correction, , produces nearly the same reduction in bias but sometimes with inadequate coverage (see Table S1). Regardless, there is a better, more direct, way to adjust degrees of freedom for UWLS—.
3.2.2 | Reducing meta-analysis of PCCs bias to triviality: UWLS+3
As shown above, Equation (7), the biases of these meta-analysis estimators are nearly an exact function of the inverse degrees of freedom (df). Note further that df is in the denominator of Gustafson's PCC transformation formula, Equation (2), making all PCCs an inverse function of the degrees of freedom. This suggests that a simple adjustment of df in Equation (2) might provide a solution. Numerical analysis finds that adding 3 to df successfully reduces these small-sample biases to scientific triviality. Because Gustafson's PCC transformation formula is almost always used in PCC meta-analysis applications, adjusting the degrees of freedom here requires no additional steps. We call the resulting transformed weighted average "."
substitutes degrees of freedom that are three larger than the multiple regression's degrees of freedom into PCC's transformation formula, Equation (2), and uses , Equation (4), as the variance. That is, calculates PCCs as:
for with as the number of independent variables in the multiple regression held constant in the calculation of the partial correlation of interest (i.e., ). This transformation can also be used in conjunction with RE, but doing so produces worse statistical properties than UWLS in some conditions.v
3.2.3 | Simulation findings
employs the same simulation design as before; however, it replaces the degrees of freedom in the PCCs transformation formula with values that are three units greater than the degrees of freedom in the multiple regression. As displayed in Table 2, eliminates all biases to within , and its average absolute bias is only 0.0002. also greatly reduces these biases, but not to the extent that does, nor are coverages as close to 95% as are 's. Table 2 assumes that either there are two independent variables in the multiple regression or four . To ensure broader generalizability, Table S2 reports the same simulation design as Table 2, except and 10. Induction suggests that if you can prove trivial bias for one (i.e., ; Table 2) and trivial bias for some random (e.g., ), then trivial biases generalize to any (e.g., {5, 9}, Table S2). As a further corroboration of the effective elimination of meta-analysis bias, Table S3 reports the same simulation design but with different values of the population PCC, {0.9487; 0.2425; 0}. Also note Table S4 where the same simulation design is reported but with different numbers of PCCs, {10; 200}. Table S5 reports simulations of meta-analyses where each has a distribution of sample sizes, {30, 40, 50, 75, 100, 100, 125, 160, 200, 400}, typically seen in the meta-analysis of correlations in psychology.17,18 In all cases, these adjustments drive the small-sample biases to scientific negligibility and their relative evaluations remain unchanged.
| Design | n | Bias REss | Bias REz | Bias UWLS+3 | RMSE REss | RMSE REz | RMSE UWLS+3 | Coverage REss | Coverage REz | Coverage UWLS+3 |
|---|---|---|---|---|---|---|---|---|---|---|
| 0.7071 | 25 | −0.0070 | 0.0078 | 0.0009 | 0.0161 | 0.0168 | 0.0155 | 0.9891 | 0.9281 | 0.9431 |
| 0.7071 | 50 | −0.0037 | 0.0036 | 0.0001 | 0.0107 | 0.0109 | 0.0105 | 0.9914 | 0.9460 | 0.9511 |
| 0.7071 | 100 | −0.0019 | 0.0017 | −0.0001 | 0.0075 | 0.0073 | 0.0072 | 0.9923 | 0.9530 | 0.9514 |
| 0.7071 | 200 | −0.0010 | 0.0008 | −0.0001 | 0.0051 | 0.0051 | 0.0051 | 0.9938 | 0.9539 | 0.9503 |
| 0.7071 | 400 | −0.0004 | 0.0004 | 0.0000 | 0.0035 | 0.0036 | 0.0036 | 0.9953 | 0.9551 | 0.9480 |
| 0.3162 | 25 | 0.0050 | 0.0067 | 0.0008 | 0.0281 | 0.0284 | 0.0275 | 0.9516 | 0.9492 | 0.9408 |
| 0.3162 | 50 | 0.0017 | 0.0032 | 0.0003 | 0.0188 | 0.0190 | 0.0187 | 0.9569 | 0.9519 | 0.9458 |
| 0.3162 | 100 | 0.0008 | 0.0014 | 0.0000 | 0.0129 | 0.0131 | 0.0130 | 0.9626 | 0.9553 | 0.9460 |
| 0.3162 | 200 | 0.0005 | 0.0006 | −0.0002 | 0.0091 | 0.0091 | 0.0091 | 0.9646 | 0.9567 | 0.9482 |
| 0.3162 | 400 | 0.0002 | 0.0004 | 0.0000 | 0.0063 | 0.0064 | 0.0064 | 0.9659 | 0.9556 | 0.9497 |
| 0.1104 | 25 | 0.0016 | 0.0024 | 0.0002 | 0.0306 | 0.0306 | 0.0301 | 0.9478 | 0.9545 | 0.9368 |
| 0.1104 | 50 | 0.0007 | 0.0011 | 0.0000 | 0.0208 | 0.0206 | 0.0203 | 0.9496 | 0.9593 | 0.9481 |
| 0.1104 | 100 | 0.0004 | 0.0007 | 0.0001 | 0.0143 | 0.0143 | 0.0142 | 0.9527 | 0.9584 | 0.9489 |
| 0.1104 | 200 | 0.0003 | 0.0002 | −0.0001 | 0.0099 | 0.0100 | 0.0100 | 0.9573 | 0.9569 | 0.9485 |
| 0.1104 | 400 | 0.0001 | 0.0001 | −0.0001 | 0.0069 | 0.0071 | 0.0070 | 0.9609 | 0.9564 | 0.9495 |
| Average | 0.0017a | 0.0021 | .0002a | 0.0134 | 0.0135 | 0.0132 | 0.9688 | 0.9527 | 0.9471 |
| Design | n | Bias REss | Bias REz | Bias UWLS+3 | RMSE REss | RMSE REz | RMSE UWLS+3 | Coverage REss | Coverage REz | Coverage UWLS+3 |
|---|---|---|---|---|---|---|---|---|---|---|
| 0.7071 | 25 | −0.0048 | 0.0083 | 0.0009 | 0.0160 | 0.0163 | 0.0164 | 0.9920 | 0.9284 | 0.9424 |
| 0.7071 | 50 | −0.0032 | 0.0037 | −0.0001 | 0.0108 | 0.0107 | 0.0106 | 0.9930 | 0.9434 | 0.9447 |
| 0.7071 | 100 | −0.0017 | 0.0018 | −0.0001 | 0.0074 | 0.0073 | 0.0073 | 0.9929 | 0.9513 | 0.9512 |
| 0.7071 | 200 | −0.0009 | 0.0008 | −0.0001 | 0.0051 | 0.0050 | 0.0050 | 0.9949 | 0.9554 | 0.9506 |
| 0.7071 | 400 | −0.0004 | 0.0004 | 0.0000 | 0.0036 | 0.0036 | 0.0036 | 0.9935 | 0.9556 | 0.9490 |
| 0.3162 | 25 | 0.0064 | 0.0063 | 0.0000 | 0.0297 | 0.0289 | 0.0289 | 0.9491 | 0.9520 | 0.9380 |
| 0.3162 | 50 | 0.0020 | 0.0029 | −0.0001 | 0.0192 | 0.0191 | 0.0191 | 0.9551 | 0.9545 | 0.9456 |
| 0.3162 | 100 | 0.0008 | 0.0014 | −0.0001 | 0.0131 | 0.0129 | 0.0130 | 0.9606 | 0.9588 | 0.9516 |
| 0.3162 | 200 | 0.0005 | 0.0006 | −0.0001 | 0.0090 | 0.0091 | 0.0092 | 0.9658 | 0.9592 | 0.9518 |
| 0.3162 | 400 | 0.0002 | 0.0003 | −0.0001 | 0.0064 | 0.0063 | 0.0065 | 0.9642 | 0.9591 | 0.9554 |
| 0.1104 | 25 | 0.0025 | 0.0029 | 0.0005 | 0.0325 | 0.0312 | 0.0316 | 0.9440 | 0.9553 | 0.9379 |
| 0.1104 | 50 | 0.0010 | 0.0012 | 0.0000 | 0.0212 | 0.0209 | 0.0209 | 0.9508 | 0.9580 | 0.9463 |
| 0.1104 | 100 | 0.0004 | 0.0007 | 0.0001 | 0.0145 | 0.0144 | 0.0145 | 0.9548 | 0.9553 | 0.9473 |
| 0.1104 | 200 | 0.0001 | 0.0002 | −0.0001 | 0.0102 | 0.0100 | 0.0101 | 0.9508 | 0.9562 | 0.9472 |
| 0.1104 | 400 | −0.0001 | 0.0001 | 0.0000 | 0.0070 | 0.0071 | 0.0071 | 0.9597 | 0.9543 | 0.9458 |
| Average | 0.0017a | 0.0021 | .0002a | 0.0137 | 0.0138 | 0.0135 | 0.9681 | 0.9531 | 0.9470 |
Note: is the "true" population mean partial correlation coefficient (PCC). n is the sample size used in the primary study's multiple regression. Bias is the difference between the meta-analysis estimate and calculated from 50 estimated partial correlation coefficients and averaged across 10,000 replications. RMSE is the square root of the mean squared error. Coverage is the proportion of 10,000 meta-analysis 95% confidence intervals that contain . is the random-effect's estimate of the mean using , from Equation (3) and the small-sample adjustment . is the unrestricted weighted least squares' estimate of the mean using from Equation (4) and as the degrees of freedom in PCC's formula. is the random-effect's estimate of Fisher's z converted back to PCC. a Average biases are averages across the absolute values of the biases. Biases reported as "0.0000" are .
Now that we have found ways to reduce these biases to scientific triviality, what causes these biases of the conventional meta-analysis of partial correlations? The simple answer is that both formulas for the variance of PCCs are themselves a function of the PCC. Because the weights of meta-analysis are a strictly increasing function of , it follows that for all {0 or 1} positive sampling errors are assigned more influence on the meta-analysis estimate compared to negative sampling errors of the same magnitude. In all meta-analyses that use inverse variance weights, based on either or , an upwards bias in magnitude will arise: the absolute expected value delivered by the meta-analysis will surpass if the true correlation is not 0 or 1.
Let us assume, for instance, that and examine how estimates with errors of the same magnitude but different signs are weighted in meta-analysis. For , an UWLS estimate with a sampling error of is assigned a weight proportional to , in stark contrast to for a sampling error. Here estimates with positive errors are assigned nearly four times more influence than estimates with negative errors but equal in size. Few sampling errors will in practice be as large as , but the aforementioned principle of asymmetric weighting as the source of bias in conventional meta-analysis of partial correlations holds in general: for all sizes of sampling errors and various meta-analysis estimators. Because RE's weights are the inverse of the sampling variance plus a positive constant , this asymmetric weighting of sampling errors is moderated, but not eliminated, by RE. Table 1 shows that RE's biases are somewhat smaller than UWLS', just as we would expect, and these differences are especially clear for small samples when is used. Asymmetric weighting of sampling errors biases weighted averages upwards in magnitude. Table 1 confirms these biases.
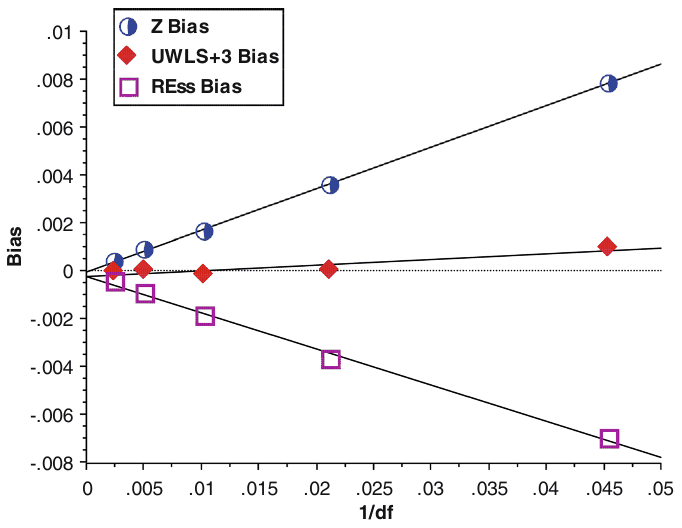
For bivariate correlations, this issue that the variance is a function of the effect size and that this may be problematic for meta-analysis is widely known. The conventional solution is to convert correlations to Fisher z's, calculate the meta-analysis estimate of the mean and its related statistics, then convert these terms of Fisher z back to correlations for the purpose of interpretation.19 As Fisher noted, what is true for correlations is true for partial correlations after degrees of freedom are adjusted for the number of variables eliminated, .6 Tables 2 and S1–S3 also report the biases, RMSEs, and coverage rates for RE estimates of Fisher's z that have been converted back to PCCs. Using Fisher's z eliminates most of these small-sample biases. Its biases and MSEs are nearly the same as the simple RE correction for small-sample bias. However, in all cases and by all criteria, , has better statistical properties than either Fisher's z or (Table 2). Although Fisher's z and produce biases larger than rounding error only for small samples and medium or larger correlations, 's bias is still 10 times smaller, see Figure 2. Likewise, 's RMSEs are smaller, and its coverage rates are closer to the nominal 95% than Fisher's z or . In fact, CIs are too narrow for large PCCs. Practically speaking, however, all three: Fisher's z, , and solve this problem of biased meta-analyses of partial correlations in the vast majority of cases even though is slightly better.
3.3 | Heterogeneity
Notable heterogeneity across studies within an area of research is common in all disciplines. In psychology, for example, the observed variance from study-to-study is about 4 times larger than what reported standard errors imply (i.e., median ).18 To ensure that partial correlation's biases are robust to heterogeneity, we have modified the same simulation design to produce heterogeneity at levels seen in psychology. Tables 3 and 4 report the same simulations as Tables 1 and 2, except that random heterogeneity is added to each study's estimated correlation in each meta-analysis. We first convert each randomly generated estimated PCC to Cohen's d, add a random normal deviation with mean zero and standard deviation {0.5, 0.3, 0.2d} as is: {0.7071, 0.3162, 0.1104}, and, lastly, transform this back to a partial correlation. That is, the simulations fix to be {0.5, 0.3, 0.2d} as is: {0.7071, 0.3162, 0.1104}. We transform to Cohen's d in this way to produce random heterogeneity consistent with the random-effect model and to reproduce roughly the same distribution of heterogeneity as seen in psychology, in both absolute terms (d) and relatively .vi Table 3 shows that the biases of the meta-analysis of correlations remain, while Table 4 confirms that Fisher's z and the small-sample corrections introduced here consistently reduce these biases to scientific negligibility.
| Design | Bias RE1 | Bias RE2 | Bias UWLS1 | Bias UWLS2 | RMSE RE1 | RMSE RE2 | RMSE UWLS1 | RMSE UWLS2 | Coverage RE1 | Coverage RE2 | Coverage UWLS1 | Coverage UWLS2 | |
|---|---|---|---|---|---|---|---|---|---|---|---|---|---|
| 0.7071 | 0.369 | 0.0385 | 0.0245 | 0.0710 | 0.0270 | 0.0435 | 0.0317 | 0.0736 | 0.0328 | 0.3931 | 0.7546 | 0.0322 | 0.4151 |
| 0.7071 | 0.559 | 0.0124 | 0.0068 | 0.0459 | 0.0149 | 0.0214 | 0.0198 | 0.0485 | 0.0216 | 0.7771 | 0.8724 | 0.1362 | 0.6138 |
| 0.7071 | 0.731 | −0.0012 | −0.0045 | 0.0347 | 0.0095 | 0.0156 | 0.0168 | 0.0374 | 0.0169 | 0.9018 | 0.9143 | 0.2611 | 0.7180 |
| 0.7071 | 0.848 | −0.0086 | −0.0105 | 0.0292 | 0.0069 | 0.0171 | 0.0184 | 0.0320 | 0.0149 | 0.8657 | 0.8746 | 0.3571 | 0.7586 |
| 0.7071 | 0.920 | −0.0125 | −0.0136 | 0.0268 | 0.0058 | 0.0190 | 0.0198 | 0.0296 | 0.0140 | 0.7970 | 0.8217 | 0.4035 | 0.7753 |
| 0.3162 | 0.404 | 0.0241 | 0.0105 | 0.0601 | 0.0209 | 0.0429 | 0.0355 | 0.0715 | 0.0396 | 0.8424 | 0.9134 | 0.5489 | 0.8360 |
| 0.3162 | 0.516 | 0.0087 | 0.0011 | 0.0343 | 0.0109 | 0.0285 | 0.0266 | 0.0445 | 0.0287 | 0.9099 | 0.9354 | 0.7167 | 0.8845 |
| 0.3162 | 0.668 | 0.0004 | −0.0036 | 0.0232 | 0.0064 | 0.0225 | 0.0225 | 0.0330 | 0.0233 | 0.9396 | 0.9396 | 0.8015 | 0.9116 |
| 0.3162 | 0.801 | −0.0038 | −0.0058 | 0.0184 | 0.0045 | 0.0205 | 0.0209 | 0.0279 | 0.0207 | 0.9459 | 0.9404 | 0.8370 | 0.9224 |
| 0.3162 | 0.890 | −0.0061 | −0.0071 | 0.0159 | 0.0034 | 0.0202 | 0.0205 | 0.0257 | 0.0198 | 0.9312 | 0.9282 | 0.8543 | 0.9203 |
| 0.1104 | 0.319 | 0.0108 | 0.0049 | 0.0217 | 0.0079 | 0.0378 | 0.0346 | 0.0457 | 0.0360 | 0.9182 | 0.9334 | 0.8641 | 0.9168 |
| 0.1104 | 0.363 | 0.0049 | 0.0015 | 0.0108 | 0.0037 | 0.0263 | 0.0251 | 0.0293 | 0.0257 | 0.9332 | 0.9398 | 0.9102 | 0.9343 |
| 0.1104 | 0.498 | 0.0017 | −0.0001 | 0.0063 | 0.0019 | 0.0204 | 0.0200 | 0.0221 | 0.0204 | 0.9336 | 0.9352 | 0.9242 | 0.9342 |
| 0.1104 | 0.661 | 0.0001 | −0.0008 | 0.0044 | 0.0012 | 0.0170 | 0.0169 | 0.0182 | 0.0172 | 0.9447 | 0.9448 | 0.9344 | 0.9415 |
| 0.1104 | 0.795 | −0.0010 | −0.0015 | 0.0032 | 0.0006 | 0.0156 | 0.0156 | 0.0165 | 0.0158 | 0.9435 | 0.9410 | 0.9369 | 0.9419 |
| Average | 0.0090a | 0.0065a | 0.0271 | 0.0084 | 0.0245 | 0.0230 | 0.0370 | 0.0232 | 0.8651 | 0.9059 | 0.6346 | 0.8283 |
Note: is the "true" population mean partial correlation coefficient (PCC). Sample sizes as the same as reported in Tables 1 and 2. is a relative measure of heterogeneity. Bias is the difference between the meta-analysis estimate and calculated from 50 estimated partial correlation coefficients and averaged across 10,000 replications. RMSE is the square root of the mean squared error. Coverage is the proportion of 10,000 meta-analyses' 95% confidence intervals that contain . RE is the random-effect's estimate of the mean, and UWLS is the unrestricted weighted least squares' estimate of the mean. The subscripts (1 and 2) refer to the use of either the PCC variance, from Equation (3) or from Equation (4) to calculate the RE and UWLS weighted averages. a Average biases are averages across the absolute values of the biases.
| Design | Design | Bias REss | Bias REz | Bias UWLS+3 | RMSE REss | RMSE REz | RMSE UWLS+3 | Coverage REss | Coverage REz | Coverage UWLS+3 |
|---|---|---|---|---|---|---|---|---|---|---|
| 0.7071 | 0.369 | −0.0058 | 0.0024 | 0.0041 | 0.0199 | 0.0199 | 0.0203 | 0.9614 | 0.9404 | 0.9465 |
| 0.7071 | 0.559 | −0.0068 | −0.0016 | 0.0043 | 0.0192 | 0.0165 | 0.0167 | 0.9110 | 0.9429 | 0.9378 |
| 0.7071 | 0.730 | −0.0113 | −0.0038 | 0.0043 | 0.0198 | 0.0152 | 0.0149 | 0.8717 | 0.9392 | 0.9397 |
| 0.7071 | 0.848 | −0.0140 | −0.0046 | 0.0045 | 0.0205 | 0.0145 | 0.0140 | 0.8233 | 0.9340 | 0.9333 |
| 0.7071 | 0.919 | −0.0154 | −0.0053 | 0.0044 | 0.0210 | 0.0144 | 0.0136 | 0.7897 | 0.9279 | 0.9317 |
| 0.3162 | 0.404 | −0.0004 | 0.0037 | 0.0020 | 0.0333 | 0.0327 | 0.0331 | 0.9305 | 0.9421 | 0.9388 |
| 0.3162 | 0.515 | −0.0049 | 0.0001 | 0.0018 | 0.0265 | 0.0256 | 0.0261 | 0.9328 | 0.9470 | 0.9456 |
| 0.3162 | 0.669 | −0.0068 | −0.0013 | 0.0022 | 0.0233 | 0.0222 | 0.0226 | 0.9316 | 0.9427 | 0.9447 |
| 0.3162 | 0.800 | −0.0075 | −0.0022 | 0.0022 | 0.0215 | 0.0204 | 0.0207 | 0.9274 | 0.9398 | 0.9416 |
| 0.3162 | 0.890 | −0.0077 | −0.0025 | 0.0023 | 0.0204 | 0.0190 | 0.0192 | 0.9270 | 0.9430 | 0.9461 |
| 0.1104 | 0.320 | 0.0012 | 0.0018 | 0.0003 | 0.0326 | 0.0334 | 0.0335 | 0.9413 | 0.9461 | 0.9373 |
| 0.1104 | 0.364 | −0.0006 | 0.0005 | 0.0003 | 0.0245 | 0.0248 | 0.0249 | 0.9405 | 0.9427 | 0.9417 |
| 0.1104 | 0.500 | −0.0006 | 0.0001 | 0.0004 | 0.0193 | 0.0199 | 0.0201 | 0.9460 | 0.9415 | 0.9440 |
| 0.1104 | 0.661 | −0.0010 | −0.0001 | 0.0006 | 0.0167 | 0.0170 | 0.0172 | 0.9449 | 0.9445 | 0.9482 |
| 0.1104 | 0.795 | −0.0014 | −0.0004 | 0.0004 | 0.0154 | 0.0154 | 0.0155 | 0.9450 | 0.9460 | 0.9506 |
| Average | 0.0057a | 0.0020a | 0.0023 | 0.0223 | 0.0207 | 0.0208 | 0.9149 | 0.9413 | 0.9418 |
| Design | Design | Bias REss | Bias REz | Bias UWLS+3 | RMSE REss | RMSE REz | RMSE UWLS+3 | Coverage REss | Coverage REz | Coverage UWLS+3 |
|---|---|---|---|---|---|---|---|---|---|---|
| 0.7071 | 0.349 | −0.0031 | 0.0033 | 0.0044 | 0.0195 | 0.0206 | 0.0209 | 0.9671 | 0.9372 | 0.9422 |
| 0.7071 | 0.549 | −0.0062 | −0.0016 | 0.0042 | 0.0191 | 0.0165 | 0.0167 | 0.9183 | 0.9459 | 0.9430 |
| 0.7071 | 0.726 | −0.0110 | −0.0039 | 0.0042 | 0.0195 | 0.0152 | 0.0148 | 0.8738 | 0.9402 | 0.9421 |
| 0.7071 | 0.847 | −0.0139 | −0.0049 | 0.0043 | 0.0203 | 0.0147 | 0.0140 | 0.8284 | 0.9331 | 0.9367 |
| 0.7071 | 0.919 | −0.0152 | −0.0050 | 0.0048 | 0.0208 | 0.0141 | 0.0135 | 0.7963 | 0.9325 | 0.9326 |
| 0.3162 | 0.398 | 0.0008 | 0.0048 | 0.0025 | 0.0347 | 0.0338 | 0.0342 | 0.9272 | 0.9461 | 0.9386 |
| 0.3162 | 0.508 | −0.0041 | 0.0005 | 0.0021 | 0.0267 | 0.0259 | 0.0264 | 0.9348 | 0.9440 | 0.9433 |
| 0.3162 | 0.665 | −0.0069 | −0.0016 | 0.0018 | 0.0232 | 0.0222 | 0.0225 | 0.9311 | 0.9425 | 0.9439 |
| 0.3162 | 0.800 | −0.0073 | −0.0019 | 0.0025 | 0.0213 | 0.0202 | 0.0205 | 0.9323 | 0.9454 | 0.9465 |
| 0.3162 | 0.889 | −0.0081 | −0.0023 | 0.0026 | 0.0207 | 0.0192 | 0.0195 | 0.9262 | 0.9413 | 0.9433 |
| 0.1104 | 0.323 | 0.0012 | 0.0020 | 0.0004 | 0.0344 | 0.0346 | 0.0346 | 0.9392 | 0.9473 | 0.9365 |
| 0.1104 | 0.358 | −0.0001 | 0.0007 | 0.0004 | 0.0247 | 0.0251 | 0.0252 | 0.9410 | 0.9437 | 0.9421 |
| 0.1104 | 0.495 | −0.0010 | 0.0005 | 0.0009 | 0.0199 | 0.0198 | 0.0200 | 0.9392 | 0.9446 | 0.9462 |
| 0.1104 | 0.658 | −0.0011 | −0.0005 | 0.0002 | 0.0167 | 0.0171 | 0.0173 | 0.9403 | 0.9390 | 0.9431 |
| 0.1104 | 0.794 | −0.0014 | −0.0004 | 0.0005 | 0.0153 | 0.0154 | 0.0156 | 0.9451 | 0.9410 | 0.9457 |
| Average | 0.0054a | 0.0023a | 0.0024 | 0.0224 | 0.0209 | 0.0210 | 0.9160 | 0.9416 | 0.9417 |
Note: is the "true" population mean partial correlation coefficient (PCC). The sample sizes of the primary study's multiple regressions are the same as reported in Tables 1 and 2. Bias is the difference between the meta-analysis estimate and calculated from 50 estimated partial correlation coefficients and averaged across 10,000 replications. RMSE is the square root of the mean squared error. Coverage is the proportion of 10,000 meta-analysis 95% confidence intervals that contain . is the random-effect's estimate of the mean using , from Equation (4) and the small-sample adjustment . is the unrestricted weighted least squares' estimate of the mean using from Equation (4) and as the degrees of freedom in PCC's formulae. is the random-effect's estimate of Fisher's z converted back to PCC. a Average biases are averages across the absolute values of the biases. Biases reported as "0.0000" are .
4 | DISCUSSION
Meta-analyses of PCCs are generally biased. We offer new solutions: and the small-sample correction, . Although these biases are ubiquitous, the good news is that they practically and scientifically disappear when the primary studies employ larger samples . Thus, these biases will typically not be a notable factor in the meta-analysis of econometric studies in economics and finance, which often involve hundreds of observations or more.vii Nonetheless, for many areas of education, business, psychology, medicine and health, meta-analysts should use , , or Fisher's z in the meta-analysis of PCCs.
An important limitation to our study is that the primary research literatures will typically be much richer than what our simulations have assumed. We abstract from such complexities to isolate and detect these biases and then to understand their underlying cause. However, many meta-analyses will include some studies which may be sufficiently large to have negligible bias, which will likely moderate the biases of these weighted averages. Thus, in most social science applications, it is unlikely that the bias of the meta-analysis of PCCs will be as large as those revealed here in small samples.
Both and are easy to implement. To calculate , meta-analysts merely need to add 3 to df in PCC's transformation formula, Equation (2), and use Equation (4) to calculate PCC's variance, . is the simple regression coefficient, Equation (6), and it can be estimated using any regression software. Note that UWLS' regression does not have an intercept (or a "constant"). Aside from small improvements to bias, MSE, and coverage rates over Fisher's z,viii 's advantage lies in its computational simplicity and the clarity of its interpretation.
Unlike the meta-analysis of Fisher's z, is a partial correlation and can be understood entirely as such. Neither nor need to be transformed back to a correlation to be interpretable. This is particularly helpful for multiple meta-regression analysis (MRA). In economics applications, meta-analyses of PCCs are common and frequently involve a dozen or more moderator variables. To understand the impact of important MRA coefficients, it is necessary to interpret them in terms of the effect size studied, in this case PCCs. When Fisher's zs are the object of meta-analysis and MRA, it is easy to misinterpret MRA results as correlations. With multiple MRA, the inverse Fisher's z transformation, , would need to be separately employed multiple times if Fisher's zs are meta-analyzed.
Computational simplicity and clarity of interpretation are also advantages of . When there is little or no heterogeneity, Table 2, dominates both Fisher's z and . However, has a limitation not seen in either or Fisher's z. When the "true" correlation is very large, , has notably larger biases than either or Fisher's z. However, we have not seen average PCCs as large 0.7 in any economics meta-analysis,ix and no bivariate average correlation (RE) has an absolute value larger than 0.6 among the 108 Psychological Bulletin meta-analyses.17
5 | CONCLUSION
We find that all meta-analyses of partial correlations are biased, and we offer simple remedies for these biases, and . Both make a simple adjustment to the degrees of freedom used to calculate partial correlations and thereby render trivial any remaining bias. generally outperforms and the more cumbersome application of Fisher's z, but all three reduce bias to trivial magnitudes in the great majority of practical applications. Our simulations also reveal that all biases are small-sample biases . Thus, in applications where primary studies typically have hundreds and even more observations, PCCs can be meta-analyzed in any of the above ways without notable bias. However, for many fields in the social and the medical sciences where small-sample studies dominate, these small-sample biases are easily avoidable by employing , , or Fisher's z.
AUTHOR CONTRIBUTIONS
T. D. Stanley: Conceptualization; formal analysis; investigation; methodology; software; writing – original draft; writing – review and editing. Hristos Doucouliagos: Conceptualization; investigation; writing – original draft; writing – review and editing. Tomas Havranek: Conceptualization; methodology; writing – original draft; writing – review and editing.
ACKNOWLEDGMENTS
Havranek acknowledges support from the Czech Science Foundation (#24-11583S) and from NPO "Systemic Risk Institute" LX22NPO5101, funded by the European Union—Next Generation EU (Czech Ministry of Education, Youth and Sports, NPO: EXCELES). Open access publishing facilitated by Deakin University, as part of the Wiley - Deakin University agreement via the Council of Australian University Librarians.
CONFLICT OF INTEREST STATEMENT
The authors have no conflicts of interest.
DATA AVAILABILITY STATEMENT
No new data were created or analyzed. The simulation codes are available in the online supplement.
ORCID
T. D. Stanley https://orcid.org/0000-0002-3205-1983
REFERENCES
Some entries below were printed without a link. Where a Crossref record matches one and no other record plausibly could, its DOI is shown; ambiguous references are left as they were printed.
- Aloe AM, Thompson CG. The synthesis of partial effect sizes. J Soc Soc Work and Res. 2013;4(4):390-405. 10.5243/jsswr.2013.24
- Stanley TD, Doucouliagos H. Meta-Regression Analysis in Economics and Business. Routledge; 2012. 10.4324/9780203111710
- Olkin I, Pratt JW. Unbiased estimation of certain correlation coefficients. Ann Math Stat. 1958;29:201-211. 10.1214/aoms/1177706717
- Stanley TD, Doucouliagos H. Correct standard errors can bias meta-analysis. Res Synth Methods. 2023;14:515-519. 10.1002/jrsm.1631
- Rockers PC, Røttingen J, Shemilt I, Tugwell P, Barnighausen T. Inclusion of quasi-experimental studies in systematic reviews of health systems research. Health Pol. 2015;119:511-521. 10.1016/j.healthpol.2014.10.006
- Fisher RA. The distribution of the partial correlation coefficient. Metron. 1924;3:329-332.
- Gustafson RL. Partial correlations in regression computations. JASA. 1961;56(294):363-367.
- Havranek T, Irsova Z, Zeynalova O. Tuition fees and university enrolment: a meta-regression analysis. Oxford Bull Econ Stat. 2018;80:1145-1184. 10.1111/obes.12240 Full text on this site
- Geyer-Klingeberg J, Hang M, Rathgeber AW. What drives financial hedging? A meta-regression analysis of corporate hedging determinants. Inter Rev Fin Anal. 2019;61:203-221. 10.1016/j.irfa.2018.11.006
- Olkin I, Siotani M. Asymptotic distribution of functions of a correlation matrix. In: Ikeda S, ed. Essays in Probability and Statistics. Shinko Tsusho; 1976:235-251.
- Aert VR, Goos C. A critical reflection on computing the sampling variance of the partial correlation coefficient. Res Synth Methods. 2023;14:520-525. doi:10.1002/jrsm.1632
- Levy KJ, Narula SC. Testing hypotheses concerning partial correlations: some methods and discussion. Int Statis Rev/Revue Internationale de Statistique. 1978;46(2):215-218. 10.2307/1402814
- Wooldridge JM. Introductory Econometrics. 2ed ed. Thompson; 2003.
- Stanley TD, Doucouliagos H. Neither fixed nor random: weighted least squares meta-analysis. Stat Med. 2015;34:2116-2127. 10.1002/sim.6481
- Stanley TD, Doucouliagos H. Neither fixed nor random: weighted least squares meta-regression. Res Synth Methods. 2017;8:19-42. 10.1002/jrsm.1211
- Stanley TD, Doucouliagos H, Ioannidis JPA. Beyond random effects: when small-study findings are more heterogeneous. Adv Methods Pract Psychol Sci. 2022;5:1-11. doi:10.1177/25152459221120427
- Stanley TD, Doucouliagos H, Havranek T. Reducing the Biases of the Conventional Meta-Analysis of Correlations. 2023 Working Paper, http://hdl.handle.net/10419/280227
- Stanley TD, Carter E, Doucouliagos H. What meta-analyses reveal about the replicability of psychological research. Psyc Bull. 2018;144:1325-1346. 10.1037/bul0000169
- Borenstein M, Hedges L, Higgins J, Rothstein H. Introduction to Meta-Analysis. Wiley; 2009. 10.1002/9780470743386
- Stanley TD, Ioannidis JPA, Maier M, Doucouliagos H, Otte WM, Bartoš F. Unrestricted weighted least squares represent medical research better than random effects in 67,308 Cochrane meta-analyses. J Clin Epidemin. 2023;157:53-58.
- Askarov Z, Doucouliagos A, Doucouliagos H, Stanley TD. Selective and (mis)leading economics journals: meta-research evidence. J Econ Surv. 2023. doi:10.1111/joes.12598
AUTHOR BIOGRAPHIES
T. D. Stanley is Professor of Meta-Analysis, Emeritus, and Honorary Professor of Economics at Deakin University, Melbourne Australia. He is an elected Fellow of the Society of Research Synthesis Methods and Convener of the Meta-Analysis of Economics Research Network and was the Julia Mobley Professor of Economics at Hendrix College, Conway USA.
Hristos Doucouliagos is Alfred Deakin Professor of Economics, Emeritus, and Honorary Professor of Economics at Deakin University, Melbourne Australia. He is Convener of the Meta-Analysis of Economics Research Network and was Chair of Economics at Deakin University.
Tomas Havranek is Professor of Economics at Charles University, Prague, working on evidence synthesis for economic decision-making, especially monetary policy. Between 2016 and 2019, he was Advisor to the Board at the Czech National Bank.
SUPPORTING INFORMATION
Additional supporting information can be found online in the Supporting Information section at the end of this article.
How to cite this article: Stanley TD, Doucouliagos H, Havranek T. Meta-analyses of partial correlations are biased: Detection and solutions. Res Syn Meth. 2024;15(2):313-325. doi:10.1002/jrsm.1704
ENDNOTES
- According to Google Scholar, 4,530 articles were published in 2022 that include the phrases "partial correlation" and "meta-analysis". Of course, not all of these studies are meta-analyses that use partial correlation coefficients. Some articles explain why they do not use partial correlations, while others are primary studies or narrative reviews citing meta-analyses. However, out of the first 100 hits, 75 are indeed meta-analyses that utilize partial correlations, as documented in our online appendix at meta-analysis.cz/pcc. It is probable that the proportion of meta-analyses using partial correlations among the Google Scholar hits will decrease further down the list. Nevertheless, even among the studies ranked between the 80th and 100th places, more than half are meta-analyses employing partial correlations. Hence, we have reason to believe that some hundreds of meta-analyses conducted in 2022 utilized partial correlations.
- The unrestricted weighted least squares (UWLS) weighted average has been shown to have better statistical properties than RE when there is publication selection bias or when heterogeneity is correlated with sample size (or SE), which meta-research evidence finds in psychology.14–16 Recently, UWLS is shown to better represent medical research than RE across over 67,000 meta-analyses of approximately 600,000 studies.20
- We also simulate more complex multiple regression with 4, 6, and 10 independent variables. Results from these more complex multiple regressions are practically equivalent and are reported below and in the Supplement. The independence or dependence of the independent X-variables from one another is immaterial to the issues at hand. All formulas for PCCs automatically account for the independence/dependence among the X-variables (as well as their correlations with the dependent variable ) no matter what they might be. This is true for the calculation of PCC from the correlation matrix or from Gustafson's t-formula, Equation (2), which give the same PC values.1,7 Also, the t-value of the partial regression coefficient and its standard error account fully for all of the relevant correlations in the correlation matrix, and this is why Gustafson's t-formula gives the same PCC as the seeming more complex correlation matrix formula.1 If we were to assume even the simplest nonzero correlations between and and that both are correlated with , the values of the population PCC would change according to a rather complex formula and our simulations would no longer be transparent. Besides, using this more complex matrix formula with dependent independent variables is unnecessary for the generalization of our findings. The biases we find will exist for the same values of the population PCC and sample size regardless of the complex or simple way that a particular value of the population PCC is arrived. This conclusion follows from Gustafson's proof of Equation (2).7 He does not assume that the independent variables are independent (or orthogonal) from each other. His proof works regardless of the dependence/independence among the independent variables. Likewise, Fisher observed that the distribution of PCCs will be the same as the simple bivariate correlation once the diminished degrees of freedom are correspondingly adjusted without reference to the independence/dependence among the independent variables, and this is confirmed by simulations.6 The biases that we find in the conventional meta-analysis of PCCs depend only on the values of the population mean PCC, sample sizes, and their corresponding distributions. Thus, we choose to derive the values of the population PCC in the most transparent and clear way possible, and, to keep our simulations consistent with the previous work on this topic, we follow the exact same simulation design (with independent independent variables) as two recent RSM papers.4,11
- These biases are largely independent of the number of PCCs (k) in the meta-analysis, but very dependent on the sample size (n) of the primary study. Stanley and Doucouliagos used other values of k and found that meta-analyses of 10 or fewer studies consistently have slightly smaller biases while those with a larger number of estimates (k = 200) have slightly larger biases. Thus, the pattern and size of these small-sample biases are largely independent of the number of PCCs (k) in the meta-analysis.4
- Random effects are often problematic relative to UWLS especially when there is publication selection bias or if small-study findings are more heterogeneous.14–16
- Generating heterogeneity through random variations to 's regression coefficient, produces approximately same overall results as Tables 3 and 4.
- Across 358 economic meta-analyses about 2/3rds of 174,542 estimates are computed from sample sizes larger than 200.21
- When there is heterogeneity and a relatively large number of studies (k = 200), Fisher's z and have virtually the same statistical properties—see Table S4.
- Among 151 meta-analyses of partial correlations for which we have data, the UWLS estimate ranges from −0.45 to 0.55. The median absolute UWLS is 0.021.21