Is research on hedge fund performance published selectively? A quantitative survey
Fan Yang, Tomas Havranek, Zuzana Irsova, and Jiri Novak (2024), "Is research on hedge fund performance published selectively? A quantitative survey." Journal of Economic Surveys 38(4): 1085-1131. https://doi.org/10.1111/joes.12574.
Fan Yang1 | Tomas Havranek1,2 | Zuzana Irsova1,3 | Jiri Novak1
1Institute of Economic Studies, Faculty of Social Sciences, Charles University, Prague, Czech Republic
2Centre for Economic Policy Research, London, UK
3Anglo-American University, Prague, Czech Republic
Correspondence
Jiri Novak, Institute of Economic Studies, Faculty of Social Sciences, Charles University, Prague, Czech Republic. Email: Jiri.Novak@fsv.cuni.cz
Funding information
NPO Systemic Risk Institute, Grant/Award Number: LX22NPO5101; Grantová Agentura České Republiky, Grant/Award Numbers: 19-26812X, 21-09231S, 23-05227M
Abstract
We examine whether estimates of hedge fund performance reported in prior empirical research are affected by publication bias. Using a sample of 1019 intercept terms from regressions of hedge fund returns on risk factors (the “alphas”) collected from 74 studies published between 2001 and 2021, we show that the selective publication of empirical results does not significantly contaminate inferences about hedge fund returns. Most of our monthly alpha estimates adjusted for the (small) bias fall within a relatively narrow range of 30–40 basis points, indicating positive abnormal returns of hedge funds: Hedge funds generate money for investors. Studies that explicitly control for potential biases in the underlying data (e.g., backfilling and survivorship biases) report lower but still positive alphas. Our results demonstrate that despite the prevalence of publication selection bias in many other research settings, publication may not be selective when there is no strong a priori theoretical prediction about the sign of the estimated coefficients.
Keywords: hedge funds, meta-analysis, publication bias
JEL CLASSIFICATION J23, J24, J31
1. INTRODUCTION
“I can’t figure out why anyone invests in active management, so asking me about hedge funds is just an extreme version of the same question. Since I think everything is appropriately priced, my advice would be to avoid high fees. So you can forget about hedge funds.”
Eugene F. Fama 1
Over the past three decades, hedge funds have experienced a spectacular increase in popularity. The value of assets under management (AUM) increased about 100 times between 1990 and 2020 (Barth et al., 2020; Stulz, 2007). This trend is difficult to reconcile with the efficient market hypotheses (EMH) (Fama, 1970), which suggests that financial markets rationally process available information and establish unbiased pricing of traded assets. Efficient financial markets should quickly eliminate any opportunities to earn abnormal returns. In efficient markets, an optimal investment strategy involves passive holding of a broad portfolio of assets (i.e., “indexing”). Consistent with this proposition, there has been a sharp rise in passive investment in recent decades. Gârleanu & Pedersen (2022) report that the proportion of wealth invested in passive funds increased from close to zero in 1990 to over 15% in 2017. Easley et al. (2021) argue that this trend has been further accelerated by the arrival of exchange-traded funds (ETFs). As passive funds do not participate in information processing and price discovery, the rise of passive investment raised concerns about its potentially detrimental impact on market efficiency. However, as argued by Stambaugh (2014), any deviations from efficient pricing create new opportunities for active investment. Thus, even though the proportion of actively managed funds has decreased over time (Stambaugh, 2014), active mutual funds and hedge funds still manage more than 30% of invested wealth, which is more than twice as much as passive mutual funds and ETFs (Gârleanu & Pedersen, 2022).
As aptly expressed in the opening quote by Eugene F. Fama, the 2013 Nobel laureate in economics, hedge funds represent an extreme form of active investment management. Consequently, they charge investors high management and performance fees. Ben-David et al. (2020) estimate that for every dollar of gross excess return earned by a hedge fund, on average, 64 cents are paid in management and incentive fees and only 36 cents are collected by the investors. Given the magnitude of these fees, it is surprising that hedge funds keep attracting growing amounts of capital.
A potential explanation for this puzzling trend is that investors have distorted views of the value hedge funds actually generate. Hedge funds are relatively lightly regulated and so they remain rather opaque in terms of their investment strategies, asset holdings, and realized returns. The paucity of information constrains systematic analysis of hedge fund performance, and it may bias investors’ expectations about hedge funds’ value-generating potential. Hedge funds are not obliged to periodically publish information on their performance. Some, but not all, voluntarily report their performance data to commercial data providers. This implies that the data available for research are fragmented and may suffer from numerous biases. Furthermore, hedge funds tend to engage in a wide range of unconventional investment strategies, so it is not trivial to adequately adjust for the risks they bear. It is not clear to what extent these constraints bias reported performance estimates. Prior empirical literature includes numerous conflicting results, which make it difficult to draw clear conclusions. The literature lacks a study synthesizing this pool of diverse empirical results.
In this paper, we perform the first quantitative survey of research literature on hedge fund performance. We aim to review and integrate published empirical findings and examine how they are affected by publication selection and data biases. Brodeur et al. (2020) argue that research methods that offer researchers more degrees of freedom are more likely to suffer from selective publication as researchers may choose research designs and data sample to generate results that are attractive for publication. We argue that the fragmentation of hedge fund performance data and the wide range of alternative approaches to controlling for risk give researchers considerable discretion in research design. Various data sources and estimation techniques may produce different results, some of which may be more attractive for publication than others. This potentially creates opportunities for selective publication that could bias the pool of coefficients reported in research articles. Hence, we believe that research literature on hedge fund performance merits a systematic investigation of the prevalence of this potential bias and of its potential impact on the reported estimates. Nevertheless, to the best of our knowledge, no prior study estimates and corrects for publication bias in this stream of literature. We provide the first quantification of the impact of potential selective publication and data biases on the hedge fund performance estimates.
We review empirical results in 74 studies on hedge fund performance published between 2001 and 2021. Our analysis is based on a sample of 1019 estimates of intercept terms (i.e., the “alphas”) from regressions of hedge fund returns on risk factors. The risk factors on the right-hand side of the regression equation represent various risk dimensions to which hedge fund investments may be exposed to. The slope coefficients (i.e., the “betas”) capture hedge funds’ exposure to the individual risk dimensions. The intercept terms, the alphas, represent the portion of realized returns that is not attributable to the fund’s exposure to the systematic risk factors. In other words, the alphas represent the abnormal return earned by the hedge fund, which represents the difference between the actual realized return and the return that would be expected as fair compensation for the investment’s systematic risk.
We examine the extent to which the alpha estimates are affected by selective publication and data biases. Publication selection bias represents a tendency to publish empirical results that are consistent with the underlying theoretical predictions or with prior empirical findings. Selective publication may result from both conscious and subconscious decisions made by authors, editors, and referees who discard results that look implausible in the light of their a priori expectations (Ioannidis et al., 2017). Publication selection bias and its implications are extensively discussed in prior literature, including Stanley (2001), Stanley (2005), Stanley et al. (2010), Havranek (2015), Brodeur et al. (2016), Bruns and Ioannidis (2016), Stanley and Doucouliagos (2017), Christensen and Miguel (2018), Brodeur et al. (2020), Blanco-Perez and Brodeur (2020), Zigraiova et al. (2021). These studies document that publication bias is widespread in a wide range of economic settings, and it substantially impacts the mean value of reported estimates. Given the discretion in research design due to data fragmentation and the variety of risk-adjustment methods, it is worthwhile to examine whether a similar bias is present also in the empirical literature on hedge fund performance.
We use several approaches to test for publication selection bias. First, we exploit the property that tests of statistical significance typically assume that publication bias is a linear function of the standard error. Hence, documenting a correlation between the two can be used as evidence on biased reporting of results in primary studies (Egger et al., 1997). We complement this conventional approach with several other recently developed techniques that use different combinations of fixed effects (FEs) and weighting that relax the assumptions about the underlying distribution of the estimated coefficients and exploit discontinuities in these distributions (Andrews and Kasy, 2019; van Aert and van Assen, 2020; Bom and Rachinger, 2019; Furukawa, 2020; Ioannidis et al., 2017; Stanley et al., 2010). Using these modern techniques allows us to evaluate the robustness of our findings to assumptions that underlie various methodological approaches.
We find that despite the multitude of data sources and methodological approaches, empirical research on hedge fund performance is not substantially contaminated by publication selection bias. In our regressions, most of the slope coefficients that capture the impact of publication bias are statistically insignificant. These results also mostly hold when we consider more homogeneous subsamples of alpha estimates that either adjust or do not adjust for survivorship and backfilling biases, subsamples that use a specific asset pricing model to compute the alphas, and subsamples of alphas sourced from the three and five leading journals in finance. A notable exception is the group of empirical estimates based on IV. Such a conclusion is consistent with a recent paper by Brodeur et al. (2020) who find that IV-based estimates are more likely to suffer from publication bias than estimates based on other techniques.
Unsurprisingly, the monthly alpha estimates adjusted for this (small) bias are fairly close to our unconditional sample mean of 36 basis points (i.e., 0.36%, which corresponds to 4.3% per annum). Our estimates suggest that the “representative” alphas corrected for the publication selection bias range from 0.274 to 0.386.2 We observe fairly similar ranges when only using observations published in the top three (0.265, 0.358) and top five (0.263, 0.355) finance journals, which suggests that publication quality does not materially affect the reported estimates. In comparison, we document a slightly higher range for estimates based on the one-factor model (0.349, 0.707) and those that are not treated for the survivorship and backfilling biases (0.282, 0.521). In contrast, we observe a lower and wider range for the “corrected” alpha coefficients based on IV techniques (−0.411, 0.298).
We make several contributions to the literature. First, using several recently developed methodological approaches, we aggregate and synthesize fragmented empirical evidence on hedge fund performance. Prior research has long acknowledged that the absence of a comprehensive database may lead to distortion and misleading findings (Agarwal et al., 2009; Fung and Hsieh, 2004a). Fung and Hsieh (2004a) point out that differences in coverage across various hedge fund data providers may lead to rather different average returns for a given hedge fund type. To illustrate this observation, they state that two data providers specified two substantially different estimates for equity market-neutral hedge funds for the month of January 2001 (−1.57 vs. 2.13%). Such discrepancies across data sources imply that the choice of the database may have a substantial impact on the estimated hedge fund performance. In a recent working paper, Joenvaara et al. (2019) underscore the importance of combining data from various databases, and they propose a new way of doing so. We offer an alternative approach to overcome the data fragmentation problem. Our approach is based on aggregating the alpha coefficients estimated in prior studies that are themselves based on various data sources. Relative to Joenvaara et al. (2019), the advantage of our approach is that it allows us to include even estimates based on private or hand-collected data and to control for potential data and publication biases simultaneously.
Second, we provide a comprehensive battery of tests to evaluate the impact of publication and data biases on hedge fund performance estimates. This paper is the first study that systematically analyzes the impact of selective publication on the reported hedge fund performance results. Recent research suggests that research settings that offer researchers considerable discretion are particularly prone to suffer from selective publication (Brodeur et al., 2020). We evaluate this effect in a research field that is characterized by fragmented data and a plurality of methodological approaches to estimate abnormal returns. Furthermore, hedge fund literature frequently mentions a concern that survivorship and backfilling biases may distort estimates of hedge fund performance (Fung and Hsieh, 2004a). Prior studies typically address this issue by measuring the returns of funds of funds (FoFs) as their reported performance is less likely to be affected by backfilling historical information for successfully incubated funds and by omitting data for dead funds. However, relying on the data on FoFs has several shortcomings. First, the inclusion of a hedge fund in a fund of funds is in itself an endogenous decision that has an impact on the reported returns. There is no guarantee that the funds that are actually included in the fund of funds’ portfolios are representative of the entire hedge fund population and that the individual funds are treated in these portfolios with appropriate weights relative to the general population. Second, FoFs charge investors an additional layer of management and performance fees (Stulz, 2007), which may distort the quantification of the abnormal return generated by individual hedge funds (Amin & Kat, 2003). Due to these additional costs, FoFs may not represent an attractive investment opportunity for many hedge fund investors. We offer a different approach to adjust for these issues that is based on the aggregation of estimates reported in prior studies.
Third, by documenting a publication selection bias for the subset of estimates based on IV, our study provides out-of-sample evidence in support of the recent finding by Brodeur et al. (2020), who argue that IV-based estimates are more likely to suffer from publication bias than estimates based on other techniques. When exploring the potential underlying reasons for this finding, Brodeur et al. (2020) suggest that it may arise due to the considerable discretion IV estimation gives researchers in designing their empirical tests. In line with this conjecture, the authors observe that when the instruments are relatively weak, the second-stage results are likely to be close to the conventional thresholds for statistical significance. Our evidence is consistent with this proposed explanation. We observe that IV-based estimates in our sample seem to be more likely to suffer from selective publication.
Our analysis is relevant to investors who consider investing in hedge funds, to regulators who seek the optimal design of the regulatory framework, as well as to researchers in economics and finance. Our evidence on the absence of a significant publication bias and the fairly narrow range of 30–40 basis points that we document for the corrected monthly alpha estimates allow investors to calibrate their expectations of hedge fund performance. Our study also informs regulators that even though hedge funds are not obliged to systematically publish their performance and the data are fragmented in numerous private databases, prior empirical research does not suffer from selectivity in reporting hedge fund performance. Finally, our study demonstrates that despite the prevalence of publication selection bias in numerous other research settings in economics and finance, publication tends not to be selective when there is no strong a priori theoretical prediction about the sign of the estimated coefficient and when journals may be more open to publishing statistically insignificant estimates. This may help researchers identify areas where publication bias can be expected and where, in contrast, it is less likely.
The remainder of the paper is organized as follows. In Section 2, we review prior research literature. In Section 3, we describe our data collection procedure. In Section 4, we present our main empirical results based on the full sample of alpha estimates collected from the primary studies. In Section 5, we report the results based on more homogeneous subsamples of alpha estimates. Section 6 concludes.
2. LITERATURE
The increasing prominence of hedge funds as an investment device and the increasing role they play in the economy prompted extensive empirical research aimed at evaluating how well they perform. Over the past decade, numerous studies on hedge fund performance have been published. Figure 1 shows the surging number of studies on hedge funds published in leading finance journals—the Journal of Finance, the Journal of Financial Economics, the Review of Financial Studies, the Journal of Financial and Quantitative Analysis, and the Review of Finance.
![Figure 1. Articles on hedge fund performance. [Colour figure can be viewed at wileyonlinelibrary.com]](figures/fig1.png)
Note: The figure shows the number of hedge fund-related articles in top five journals in finance (Journal of Finance, Journal of Financial Economics, Review of Financial Studies, Review of Finance, Journal of Financial and Quantitative Analysis) published in a given year excluding articles that are only published online without a print version.
Connor and Woo (2004) and Agarwal et al. (2015) provide narrative reviews of the hedge fund literature. Connor and Woo (2004) give an overview of the history of hedge funds, they discuss the key characteristics that distinguish hedge funds from other investment vehicles, outline their typical investment strategies, and discuss issues in measuring hedge fund risk and performance. Agarwal et al. (2015) concentrate more specifically on reviewing research on hedge fund performance and on factors that affect it, for example, hedge fund characteristics and the risks hedge funds take. They also discuss the role hedge funds play in the economy and their impact on asset prices, market liquidity, quality of corporate governance, and the propagation of financial crises. Furthermore, they discuss a number of issues related to the sources of data used for hedge fund research. We complement these studies by performing a quantitative analysis of whether estimates of hedge fund performance reported in prior empirical research are affected by publication selection bias.
2.1. Estimating performance
A standard challenge addressed in empirical research analyzing the performance of investment strategies (including those followed by hedge funds) is to adjust for the systematic risk these strategies involve properly. To address this issue, most modern studies on hedge fund performance report the intercept terms (the “alphas”) from regressions of hedge fund returns on various combinations of risk factors, as shown in Equation (1).
where denotes the realized return on portfolio , denotes the risk-free rate of return, represents the intercept term, represents the th risk factor, denotes the sensitivity of portfolio to the th risk factor, and represents the error term. Loadings on the risk factors (the “betas”) represent a “normal” compensation for the risk that the investment entails. The alphas capture the portion of realized returns unexplained by the set of risk factors. The alphas can thus be interpreted as “abnormal” returns that the fund generates for the investors over and above (or below if negative) what would be expected for a given level of risk. This approach explicitly models an investment’s exposure to various risk dimensions. However, the set of relevant risk dimensions is open to question. Thus prior literature provides estimates based on various risk models.
The Jensen (1968) alpha is the simplest of the intercept-based approaches. It was initially designed to measure the investment performance of mutual funds. Returns are measured relative to a benchmark that is relevant for a well-diversified investor. Building on the portfolio theory (Markowitz, 1952) and the Capital Asset Pricing Model (CAPM) (Black, 1972; Lintner, 1965; Mossin, 1966; Sharpe, 1966), this approach uses the equity market excess return as the sole risk factor. It maintains that well-diversified investors only require compensation for an investment’s contribution to the volatility of returns on the market portfolio, that is, for an investment’s systematic risk, which is in turn determined by its returns’ sensitivity to the variation in market returns. The slope coefficient beta in a regression of an investment’s excess return on the market portfolio excess returns captures this sensitivity. In contrast, the intercept term alpha represents the portion of realized excess return that cannot be explained by an investment’s contribution to the portfolio risk, that is, the value generated for investors.
The simplicity of modeling systematic risk with the use of a single risk dimension constitutes a limitation that may be particularly relevant for hedge funds that engage in complex and dynamic investment strategies that are likely to exhibit various forms of exposure to systematic risk. Due to this complexity, prior research develops risk models that are specifically designed to capture risk dimensions relevant to hedge fund strategies. Most prominently, Fung and Hsieh (2004a) and Fung et al. (2008) propose a seven-factor model that comprises risk factors that mirror various risk exposures common in popular hedge fund investment strategies. Specifically, the model comprises the following risk factors: (i) the stock market excess return, (ii) the spread between the small- and large-capitalization stock returns, the excess return pairs of lookback call and put options (iii) on currency futures, (iv) on commodity futures, and (v) on bond futures, (vi) the duration-adjusted change in the yield spread of the U.S. 10-year Treasury bond over the 3-month T-bill, and (vii) the duration-adjusted change in the credit spread of Moody’s BAA bond over the 10-year Treasury bond. These risk factors are intended to capture risk exposures of a broad set of hedge fund types ranging from equity long-short funds to managed futures funds.
The use of various pricing models has some advantages and disadvantages. The Jensen alpha is well-rooted in financial theory and universally applicable in a wide range of research settings. Hence, empirical results based on the Jensen alpha are easily comparable across various research strategies and data samples. Furthermore, the Jensen alpha is not directly affected by the “model uncertainty problem,” which results from the uncertainty over which of the multitude of variables identified in prior research to be associated with realized stock returns actually constitute the “true” returns determinants. Harvey et al. (2016) and Harvey (2017) suggest that the pool of candidate risk factors documented in prior research is overblown by the tendency to publish statistically significant rather than insignificant results, that is, “p-hacking”3. Thus, the authors argue that the variables associated with realized returns may not be true risk factors. Instead, they may represent “false positives” that will likely fail to explain the cross-sectional variation in realized returns in the future. In contrast to the universal measure of the Jensen alpha, the seven-factor model is specifically designed for research in hedge fund performance. Thus, it is likely more effective in filtering away various risk exposures relevant to complex investment strategies followed by hedge funds. Prior research offers alpha based on various risk models. In our robustness checks, we evaluate whether our findings are sensitive to limiting our analysis to a subsample of alpha coefficients that are based on the one- and seven-factor models.
2.2. Data fragmentation
Besides the uncertainty about the appropriate risk model, hedge fund performance research faces the challenge of data fragmentation. Due to the relatively light regulatory oversight, hedge funds are mostly not obliged to periodically disclose audited financial information on their performance. Hence, there is no comprehensive central depository of hedge fund data. Only a subset of funds self-select to voluntarily report information on their performance to private data providers. Thus, prior research mostly relies on data sets obtained from commercial databases or hand-collected. The data sets used in prior research may not be comprehensive, and so they may not be fully representative of the entire hedge fund population (Aggarwal & Jorion, 2010; Liang, 2000; Posthuma & Van der Sluis, 2003). This may complicate the interpretation of these findings and raise questions about the generalizability of these results to the universe of hedge funds.
Fung et al. (2006) discuss the level of overlap in hedge fund coverage between various databases. Liang (2000) and Agarwal et al. (2009) show that the information provided is not always consistent across all the databases, which implies that the results reported in prior research may be sensitive to the choice of the source database. Similarly, in a recent working paper, Joenvaara et al. (2019) propose a new way of combining data from various databases, and they conclude that using this combined database matters for a conclusion about hedge fund performance. They argue that based on this combined database, hedge fund performance appears to be lower but more persistent. These findings underscore the importance of aggregating results based on different segments of hedge fund data.
Hedge funds are not obliged to independently verify reported data by auditors or established data providers. Liang (2003) finds that surviving funds are more likely to be effectively audited, and funds with more reputable auditors report more consistent data. Patton et al. (2015) find that data on hedge fund returns change depending on when the database is accessed. They also observe that underperforming funds are more likely to alter their performance histories. Data on hedge fund returns may be unreliable because the valuation of illiquid holdings may be imprecise (Cassar & Gerakos, 2011) or because the highly incentivized managers may tamper with the reported information to give an impression of better and more stable performance (Bollen & Pool, 2009). These complications may contaminate the results of hedge fund research and affect inferences about overall hedge fund performance.
2.3. Empirical findings
Given the multitude of data sources and the range of methodological approaches used to estimate hedge fund performance, it is not surprising that prior research amassed an extensive body of sometimes conflicting empirical findings. Several studies indicate that hedge funds generate value for investors. Brown et al. (1999) document superior risk-adjusted returns in offshore hedge funds, but they find little support for performance persistence. Ackermann et al. (1999) and Liang (1999) observe that hedge funds earn higher risk-adjusted returns than mutual funds even though they have a higher overall risk due to which hedge funds do not outperform general stock market indices. Agarwal and Naik (2000) find that combining investments in hedge funds with passive investing generates better reward-risk combinations than a passive investment in various asset classes. Fung and Hsieh (2004a) propose seven risk factors relevant to hedge fund research, and they find that jointly these factors explain about 80% of hedge fund returns. Nevertheless, they also find that even after considering these risk factors, hedge funds generate positive alphas for the full sample period. Kosowski et al. (2007) use bootstrapping and Bayesian approaches to address some of the limitations common in hedge fund research. They document significant alphas and also substantial persistence in alphas in hedge funds, which suggests that the superior performance of hedge funds cannot be solely attributed to luck. Similarly, Ibbotson et al. (2011) conclude that alphas earned by hedge funds are positive and remarkably stable over time even during a financial crisis.
In contrast, Malkiel and Saha (2005) and Getmansky et al. (2015) argue that after adjusting for database biases, hedge funds on average underperform their benchmarks. Fung et al. (2008) observe a positive and statistical alpha only for an 18-month long subperiod out of the sample covering 120 months. Billio et al. (2014) conclude that the alphas generated by hedge funds change dramatically over time and across categories. Capocci and Hubner (2004) observe positive excess return for 10 out of 13 investment strategies that they analyze, but only for one-quarter of individual hedge funds. They also show that best-performing funds follow momentum strategies and have limited holdings of emerging market bonds. Also Ding and Shawky (2007) suggest that the evaluation of hedge fund performance relative to market indices depends on the level of aggregation of hedge fund data and on the adjustments for skewness in hedge fund returns distribution. They conclude that even though all hedge fund categories outperform the general market index less than half of the individual hedge funds beat it. Griffin and Xu (2009) find limited evidence of superior skills of hedge fund managers in timing the market and in picking individual stocks. The alphas they observe are small on a value-weighted basis and insignificant on an equal-weighted basis.
Some of the divergence in the reported results may be due to the data biases resulting from the voluntary nature of reporting of hedge fund performance in databases. A self-selection bias arises when successful hedge funds are more likely to report their performance to commercial databases. Jorion and Schwarz (2014) find that investment companies act strategically and they list in multiple commercial databases their small, best-performing funds, which helps them raise awareness about the funds and attract new investments (Fung & Hsieh, 1997, 2000). Agarwal et al. (2013) examine the impact of self-selection bias by comparing data in five commercial databases with information in Form 13F that are reported quarterly by advisors (rather than funds) with the Securities and Exchange Commission (SEC). They find that even though reporting initiation is more likely after a superior performance it subsequently declines. Similarly, Edelman et al. (2013) combine previously unexplored data sources with manual data collection to construct a comprehensive dataset of returns earned by large hedge fund management companies. Based on the sample covering more than half of the industry's AUM, they observe little differences between the reporting and non-reporting firms. In contrast, Aiken et al. (2013) use the mandatory regulatory filings by registered FoFs and they observe that only about one-half of these fund-level returns are reported to one of the five major hedge funds databases.
The backfilling bias or the "instant-history bias" arises when hedge funds are included in databases together with their performance history only after succeeding during an "incubation period" intended to accumulate a performance track record before offering the fund to investors. Recording performance histories of only the successful funds introduces a positive bias into the database (Fung & Hsieh, 2000; Posthuma & Van der Sluis, 2003). To quantify its effect prior research compares returns generated in the first years of hedge fund existence in the database with other years. Estimates based on this approach range between 1.0 and 1.5% per annum (Edwards and Caglayan, 2001; Fung & Hsieh, 2000).
The survivorship bias may arise when commercial databases terminate coverage of previously included funds. Providers may wish to purge the database of funds that no longer operate because they are not relevant to their clients anymore. Hodder et al. (2014) report that on average, 15% of hedge funds exit the database every year. A bias arises when the funds that exit the database on average underperform the "surviving" funds. Brown et al. (1999) examine survivorship bias in a database of active and defunct offshore funds and observe positive risk-adjusted returns even after adjusting for the bias. Liang (2000) observes that poor performance is the main reason for a fund's disappearance from the databases and finds that the survivorship bias exceeds 2% per annum and it varies with investment styles. Edwards and Caglayan (2001) compare the performance of defunct funds with those that are still in operation and they estimate the impact of the bias at 1.85% per annum. Agarwal et al. (2015) propose a range between 2.0 and 3.6% per annum.
The variability of prior empirical results and the potential impact of various data biases complicate the interpretation of this stream of research. Thus, we consider it worthwhile to conduct a quantitative survey to synthesize this pool of diverse empirical results and to examine how they are affected by publication selection and data biases. Our empirical approach builds on and complements earlier research that uses the meta-analysis methodology to study the performance of other types of funds (Coggin et al., 1993; Rathner, 2012; Revelli and Viviani, 2015). Rathner (2012) performs a meta-analysis of 500 performance estimates collected from 25 empirical studies on the performance of Socially Responsible Investment (SRI) funds and he concludes that most primary studies do not find any significant performance difference between the SRI funds and the conventional funds. Furthermore, similar to our paper, Rathner (2012) also studies the impact of treatment of the survivorship bias for the magnitude of the estimates reported in the primary studies and he concludes that primary studies that adjust for the survivorship bias are more likely to report SRI funds outperformance relative to conventional funds. Revelli and Viviani (2015) perform a meta-analysis of 85 studies and 190 experiments that examine the impact of SRI on financial performance. They conclude that, overall, SRI considerations have neither a positive nor negative impact on performance. Coggin et al. (1993) conduct a meta-analysis of the investment performance of U.S. equity pension funds and they examine their stock picking and market timing abilities. They identify substantial differences in the performance of individual funds and they observe that some funds produce substantial abnormal returns while others do not. They also conclude that regardless of the choice of benchmark portfolio or estimation model, equity pension funds exhibit superior stock-picking and inferior market-timing skills. Our paper builds on this prior research by applying these methodological approaches to measure hedge fund performance and it extends them by employing a battery of modern econometric techniques for identifying publication selection bias.
3. DATASET
To perform a comprehensive analysis of how published evidence on hedge fund performance is affected by selective publication and data biases, we collect a large dataset of alpha estimates from primary studies. Alpha estimates represent abnormal returns adjusted for exposures to risk factors. Individual alpha coefficients reported in primary studies thus aim to capture the same underlying concept of value generated by hedge funds for investors. All the collected alpha coefficients are measured in the same unit (i.e., percentage) and they are normalized to monthly frequency. Hence, they are directly comparable, which makes them suitable for aggregation in a quantitative survey.
Our data collection process follows the guidelines proposed by Havranek et al. (2020). We restrict our analysis to estimates published in peer-reviewed research journals. The peer-review process constitutes an important quality assurance mechanism. Using only estimates that underwent the peer-review process increases the likelihood that the collected alpha coefficients are estimated using established methodological approaches and they are free of error. Furthermore, we expect most researchers and practitioners to form their subjective understanding of typical alpha estimates predominantly based on published articles. Our sample, thus, likely mirrors the set of studies that shape people's views of hedge fund performance.
Figure 2 provides an overview of the individual steps of our data collection process. First, we build a preliminary list of studies based on references included in the sections on hedge fund performance in two comprehensive review articles: Connor and Woo (2004) and Agarwal et al. (2015). Second, we perform a systematic Google Scholar search using the following combinations of keywords: "hedge fund returns" OR "hedge fund performance." We search for alpha estimates in the articles as ordered by Google Scholar. We terminate this phase of data collection after having covered the first 750 articles in the Google Scholar list. We observe that after having reached this position at Google Scholar list, the articles become less relevant and the likelihood of identifying additional articles with usable alpha estimates drops dramatically. Third, to make sure that our search does not miss any important articles, we perform a slightly broader Google Scholar search using less restrictive keywords: "hedge fund" OR "hedge funds" in the following finance journals: the Journal of Finance, the Journal of Financial Economics, the Review of Financial Studies, the Journal of Financial and Quantitative Analysis, and the Review of Finance. Fourth, to ensure comprehensive coverage of articles in journals aimed primarily at investment professionals and which may not be as highly cited and ranked by Google Scholar, we perform a similar search based on the combination of keywords: "hedge fund" OR "hedge funds" in the journals listed on the Portfolio Management Research website4: the Journal of Portfolio Management, the Journal of Financial Data Science, the Journal of Impact and ESG Investing, and the Journal of Fixed Income.
To be included in the dataset, a given alpha estimate must be accompanied by a measure of statistical significance, that is, a t-statistic, a standard error (SE), and/or a p-value. We use these measures to compute the precision of individual alpha estimates. We use the precision variable in our tests of selective publication as well as for our data verification. Before constructing our final sample, we attempt to identify alpha coefficients that may have resulted from human error in data hand-collection. To do so, we first convert all the measures of statistical significance to a common metric, that is, t-statistic. Whenever available, we collect corresponding t-statistics from primary studies. If the authors report standard errors instead, we compute the implied t-statistic as the ratio of the alpha coefficient and the corresponding standard error. In studies using the Bayesian approach, we divide the alpha coefficient by the reported standard deviation. If the authors report p-values, we check whether they explicitly state that these are based on one- or two-tailed tests. If the type of the test is not explicitly stated in the article, we try to infer it from the discussion of the level of statistical significance of results tabulated in the primary studies. If the type of the test cannot be ascertained from the interpretation of the results, we assume a two-tailed test (1 study). We then use the inverse t-distribution to convert the reported p-value to a t-statistic. If the authors report the total number of observations based on which a given alpha coefficient is estimated, we use that number for the degrees of freedom. If the authors report both the number of observations in the cross-section and in the time series, we use the product of the two numbers. If the information on the number of observations is only provided for the cross-section or the time series, we use that number instead. If none of the above is provided, we assume 168 observations, which is equal to the sample median for the subsample where the number of observations is explicitly stated. We then check all observations with the implied t-statistic greater than 10 for potential errors in hand-collecting the data. We ensure that such results are presented as highly significant in the main text of the primary study. We discard the one observation where the authors report a t-statistic greater than 50.
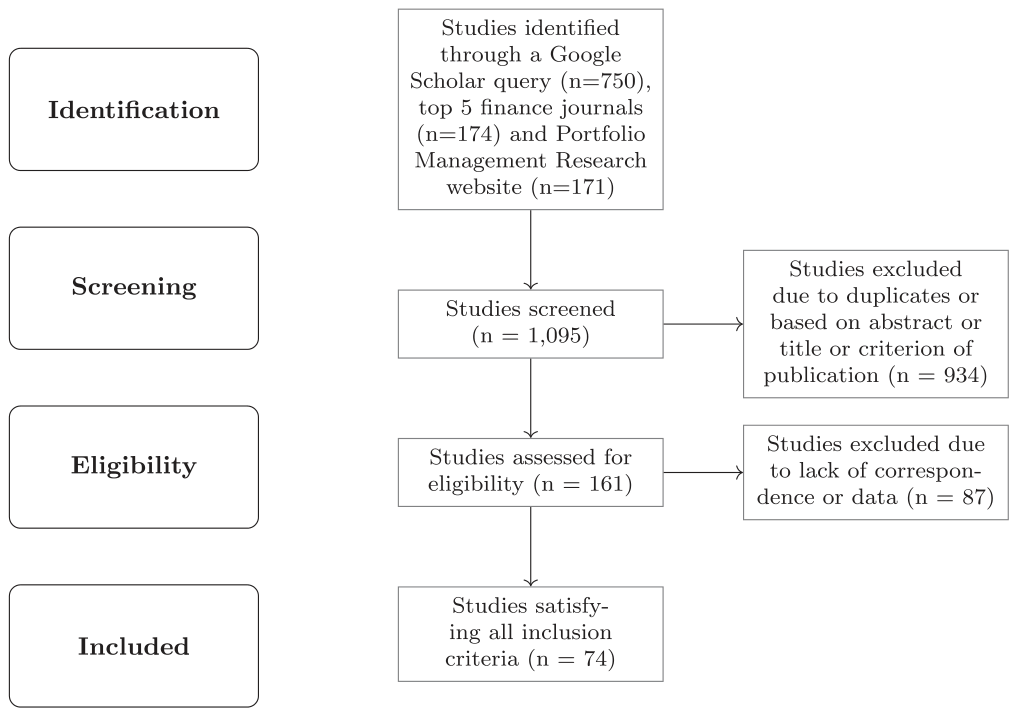
Note: We perform our primary search in Google Scholar based on the following combinations of keywords: "hedge fund returns" OR "hedge fund performance." Furthermore, we perform our secondary search based on slightly broader set of keywords: "hedge fund" OR "hedge funds" in the following finance journals: the Journal of Finance, the Journal of Financial Economics, the Review of Financial Studies, the Journal of Financial and Quantitative Analysis, and the Review of Finance. Finally, we perform our tertiary search based on the combination of keywords: "hedge fund" OR "hedge funds" in the journals listed on the Portfolio Management Research website: the Journal of Portfolio Management, the Journal of Financial Data Science, the Journal of Impact and ESG Investing, and the Journal of Fixed Income. We screen for the alpha coefficients the first 750 studies identified by our primary the Google Scholar search, as well as 174 studies identified by our secondary search in the top five finance journals, and additional 171 studies identified by our tertiary search in journals listed on the Portfolio Management Research website. We are left with 161 studies after the screening. Preferred Reporting Items for Systematic Reviews and Meta-Analyses (PRISMA) is an evidence-based set of items for reporting in systematic reviews and meta-analyses. More details on PRISMA and reporting standard of meta-analysis in general are provided by Havranek et al. (2020).
![Figure 3. Distribution of alphas. [Colour figure can be viewed at wileyonlinelibrary.com]](figures/fig3.png)
Note: The figure depicts a histogram of the alphas reported by individual studies. The solid red vertical line denotes sample mean. The gray dashed line denotes 0.
Our data collection procedure yields 1019 alpha estimates obtained from 74 primary studies. The data sample size makes our study one of the largest quantitative surveys of prior studies in financial economics. The first alpha estimates that meet the sample collection criteria specified above were published in 2001. We end our data collection on September 1, 2021. The long time span exceeding 20 years ensures that our sample of alpha estimates is representative of the accumulated pool of evidence in this stream of research literature. Figure 3 shows the histogram of the alpha estimates in our sample. The figure suggests that the distribution is fairly normal and quite symmetric. Furthermore, we do not observe any significant kinks in the distribution, which indicates that no levels of alpha estimates are significantly underrepresented or over-represented. Figure 3, thus, offers some preliminary indication that the distribution of our dataset has the expected characteristics and it is free from dramatic discontinuities.
The vertical line in Figure 3 denotes the unconditional sample mean of monthly alphas of 0.36%, which corresponds to an annual abnormal return of 4.32%. This result is broadly consistent with values proposed in prominent studies on hedge fund performance. For example, Getmansky et al. (2015) report monthly alphas based on the Fung and Hsieh (2001) seven-factor model for various hedge fund strategies between 0.18 and 0.56%. This suggests that our dataset does not dramatically differ from what would be expected based on prior literature. At the same time, the histogram shows that the individual alpha estimates are relatively dispersed. This suggests that there are substantial differences across various studies and estimation approaches.
Figure 4 visualizes the distribution of alpha estimates reported in the individual primary studies. The boxes represent the interquartile range between percentile 25 and percentile 75 and the vertical line inside each box denotes the median value for a given study. The whiskers represent the highest and lowest data points within 1.5 times the range between the upper and lower quartiles. Consistent with the preliminary indication in Figure 3, also the pattern depicted in Figure 4 shows that the individual studies differ greatly in the dispersion of reported alpha coefficients. For most studies, the interquartile ranges cross the vertical line representing the unconditional sample mean of 0.36%. However, there are some studies with interquartile ranges not overlapping with the unconditional sample mean. In fact, some of them are fully below zero. Furthermore, we observe that some studies exhibit rather wide interquartile ranges exceeding one percentage point. This suggests that even within some studies, the reported coefficients vary greatly. The substantial heterogeneity of alpha estimates reported in primary studies further underscores the importance of conducting a quantitative survey that aggregates these diverse results and corrects them for potential biases.
![Figure 4. Alphas in primary studies. [Colour figure can be viewed at wileyonlinelibrary.com]](figures/fig4.png)
Note: The figure shows the distribution of alpha coefficients across the individual primary studies (sorted alphabetically). For each study, the box represents the interquartile range (P25–P75), and the dividing line inside the box shows the median value. The whiskers represent the highest and lowest data points within 1.5 times the range between the upper and lower quartiles. The solid red vertical line denotes the sample mean; the dashed gray vertical line denotes zero. For ease of exposition, outliers are excluded from the figure but included in all statistical tests.
We report further information about the characteristics of alpha coefficients in the individual primary studies in Table 15. The table illustrates substantial differences between the individual primary studies. The number of alphas collected from a study ranges from 1 to 61. The median primary study contributes nine alpha estimates to our sample. The number of databases the alpha estimates are based on also substantially varies across the individual primary studies. The median value of one indicates that a typical study uses only one database as a source of data. This observation again highlights the importance of aggregating and synthesizing the hedge fund performance estimates. Nevertheless, the most comprehensive studies include up to seven databases. The sample period of returns data in a typical study spans 171 months, which corresponds to more than 14 years. However, some studies use data sets covering only 31 months (about 2.5 years), while others comprise 475 months, that is, almost 40 years. Most studies use only one risk model for estimating abnormal returns. However, some studies use up to seven risk models. We collect about 30% of our alpha estimates from studies published in the top five finance journals (i.e., the Journal of Finance, the Journal of Financial Economics, the Review of Financial Studies, the Journal of Financial and Quantitative Analysis, and the Review of Finance).
Table 1 also reports the mean value, the standard deviation, the minimum, the median value, and the maximum of the alpha coefficients reported in a given primary study. The mean alpha estimate reported in a study ranges from −0.51 to 1.22. This suggests that the individual primary studies reach very different conclusions about the abnormal returns generated (or destroyed) by hedge funds. Our study aggregates these diverse findings and draws inferences about the overall value reported in this stream of research. The following section presents these aggregated results.
4. FULL SAMPLE RESULTS
4.1. Funnel plot
Having observed heterogeneity in reported alpha coefficients across various studies, we now analyze whether these estimates are affected by publication selection bias. We start this analysis by visualizing how the alpha estimates reported in primary studies depend on their precision, which is defined as one over the estimate's standard error. Tests of statistical significance based on the t-distribution assume that the estimated coefficients and their standard errors are not correlated. Hence, in the absence of publication bias, there should be no systematic relationship between the alpha coefficient and its standard error. In contrast, detecting a positive or a negative association between the coefficients and standard errors suggests selective publication (Havranek & Irsova, 2010a, 2010b; Havranek & Rusnak, 2013; Stanley, 2005). The authors of primary studies usually report t-statistics for their estimates, which implies that they assume that the estimates and their standard errors are statistically independent and the ratio of the estimates to their standard errors has a t-distribution. The association between the coefficient and its standard error can thus be used to detect selective publication.
| Study | #Alphas | #Sources | #Months | #Models | Top5 | Mean | StDev | Min | Md | Max |
|---|---|---|---|---|---|---|---|---|---|---|
| Agarwal et al. (2017) | 61 | 1 | 240 | 3 | 1 | 0.27 | 0.77 | −1.80 | 0.20 | 3.00 |
| Ahoniemi and Jylha (2014) | 1 | 1 | 180 | 1 | 0 | 0.41 | 0.41 | 0.41 | 0.41 | |
| Aiken et al. (2013) | 6 | 6 | 72 | 3 | 1 | 0.22 | 0.12 | 0.09 | 0.20 | 0.40 |
| Ammann and Moerth (2005) | 3 | 1 | 136 | 2 | 0 | 0.03 | 0.02 | 0.02 | 0.03 | 0.06 |
| Ammann and Moerth (008a) | 4 | 2 | 136 | 2 | 0 | 0.25 | 0.10 | 0.20 | 0.20 | 0.40 |
| Ammann and Moerth (008b) | 2 | 1 | 136 | 2 | 0 | 0.00 | 0.01 | −0.01 | 0.00 | 0.00 |
| Aragon (2007) | 16 | 1 | 96 | 2 | 1 | 0.40 | 0.30 | −0.05 | 0.37 | 1.02 |
| Asness et al. (2001) | 20 | 1 | 81 | 2 | 0 | 0.00 | 0.51 | −1.35 | 0.12 | 0.97 |
| Bali et al. (2013) | 11 | 1 | 216 | 1 | 0 | 0.51 | 0.16 | 0.25 | 0.48 | 0.87 |
| Bhardwaj et al. (2014) | 6 | 1 | 223 | 1 | 1 | 0.66 | 0.18 | 0.36 | 0.71 | 0.84 |
| Blitz (2018) | 19 | 2 | 204 | 1 | 0 | 0.09 | 0.17 | −0.37 | 0.12 | 0.33 |
| Bollen and Whaley (2009) | 4 | 1 | 144 | 1 | 1 | 0.58 | 0.28 | 0.25 | 0.57 | 0.93 |
| Brown (2012) | 2 | 1 | 168 | 1 | 0 | 0.83 | 0.04 | 0.80 | 0.83 | 0.85 |
| Buraschi et al. (2014) | 45 | 1 | 198 | 3 | 1 | 0.30 | 0.16 | 0.01 | 0.28 | 0.75 |
| Cao et al. (2016) | 1 | 1 | 228 | 1 | 1 | 1.18 | 1.18 | 1.18 | 1.18 | |
| Chen and Liang (2007) | 10 | 3 | 138 | 7 | 1 | 0.37 | 0.20 | −0.01 | 0.41 | 0.62 |
| Chen et al. (2017) | 4 | 2 | 216 | 1 | 1 | 0.34 | 0.17 | 0.11 | 0.36 | 0.52 |
| Chincarini and Nakao (2011) | 7 | 1 | 475 | 3 | 0 | 0.47 | 0.07 | 0.37 | 0.47 | 0.55 |
| Clark and Winkelmann (2004) | 5 | 1 | 119 | 1 | 0 | 0.36 | 0.11 | 0.16 | 0.41 | 0.43 |
| Dichev and Yu (2011) | 8 | 2 | 348 | 2 | 1 | 0.36 | 0.15 | 0.11 | 0.38 | 0.53 |
| Ding and Shawky (2007) | 17 | 1 | 168 | 5 | 0 | 0.65 | 0.21 | 0.40 | 0.62 | 1.10 |
| Ding et al. (2009) | 9 | 1 | 144 | 1 | 0 | 0.73 | 0.45 | 0.07 | 0.66 | 1.58 |
| Do et al. (2005) | 26 | 1 | 31 | 1 | 0 | 0.34 | 0.51 | −0.46 | 0.18 | 1.35 |
| Duarte et al. (2007) | 4 | 3 | 194 | 1 | 1 | 0.35 | 0.14 | 0.15 | 0.39 | 0.48 |
| Edelman et al. (2012) | 6 | 4 | 72 | 3 | 0 | 0.08 | 0.26 | −0.26 | 0.07 | 0.44 |
| Study | #Alphas | #Sources | #Months | #Models | Top5 | Mean | StDev | Min | Md | Max |
|---|---|---|---|---|---|---|---|---|---|---|
| Edelman et al. (2013) | 6 | 4 | 108 | 1 | 1 | 0.06 | 0.04 | −0.02 | 0.07 | 0.09 |
| Edwards and Caglayan (2001) | 9 | 1 | 104 | 1 | 0 | 0.82 | 0.27 | 0.47 | 0.77 | 1.27 |
| Eling and Faust (2010) | 30 | 1 | 152 | 6 | 0 | 0.47 | 0.91 | −1.35 | 0.48 | 2.20 |
| Frydenberg et al. (2017) | 33 | 1 | 254 | 1 | 0 | 0.14 | 0.24 | −0.51 | 0.19 | 0.72 |
| Fung et al. (2002) | 9 | 1 | 84 | 1 | 0 | 0.36 | 0.08 | 0.19 | 0.37 | 0.46 |
| Fung and Hsieh (2004a) | 22 | 4 | 108 | 1 | 0 | 0.59 | 0.23 | 0.19 | 0.58 | 0.97 |
| Fung and Hsieh (004b) | 8 | 2 | 108 | 4 | 0 | 0.97 | 0.15 | 0.73 | 1.02 | 1.13 |
| Fung et al. (2008) | 3 | 3 | 57 | 1 | 1 | 0.36 | 0.49 | 0.06 | 0.09 | 0.93 |
| Gupta et al. (2003) | 42 | 1 | 152 | 2 | 0 | 0.73 | 0.35 | 0.06 | 0.68 | 1.64 |
| Hong (2014) | 6 | 1 | 65 | 3 | 0 | 0.15 | 0.19 | −0.10 | 0.17 | 0.42 |
| Huang et al. (2017) | 5 | 1 | 174 | 1 | 0 | −0.07 | 0.07 | −0.16 | −0.03 | −0.01 |
| Ibbotson et al. (2011) | 1 | 1 | 180 | 1 | 0 | 0.41 | 0.41 | 0.41 | 0.41 | |
| Jame (2018) | 10 | 2 | 212 | 2 | 0 | 0.20 | 0.14 | 0.04 | 0.14 | 0.52 |
| Joenvaara et al. (2019) | 5 | 5 | 228 | 1 | 1 | 0.23 | 0.12 | 0.12 | 0.16 | 0.39 |
| Joenvaara and Kosowski (2021) | 17 | 7 | 120 | 5 | 1 | −0.37 | 0.26 | −0.74 | −0.36 | 0.27 |
| Jordan and Simlai (2011) | 12 | 1 | 180 | 1 | 0 | 0.57 | 0.20 | 0.25 | 0.58 | 0.97 |
| Jylha et al. (2014) | 1 | 1 | 216 | 1 | 1 | 0.29 | 0.29 | 0.29 | 0.29 | |
| Kanuri (2020) | 2 | 1 | 225 | 2 | 0 | 0.23 | 0.01 | 0.22 | 0.23 | 0.24 |
| Klein et al. (2015) | 30 | 4 | 108 | 1 | 0 | 0.34 | 0.34 | −0.30 | 0.30 | 1.00 |
| Kooli and Stetsyuk (2021) | 2 | 1 | 289 | 2 | 0 | −0.51 | 0.19 | −0.64 | −0.51 | −0.37 |
| Kosowski et al. (2007) | 9 | 5 | 108 | 2 | 1 | 0.42 | 0.07 | 0.27 | 0.42 | 0.51 |
| Kotkatvuori-Ornberg et al. (2011) | 6 | 1 | 175 | 1 | 0 | 0.22 | 0.38 | −0.39 | 0.20 | 0.64 |
| Liang (2004) | 20 | 1 | 36 | 5 | 0 | 1.11 | 0.77 | −0.04 | 0.87 | 3.50 |
| Ling et al. (2015) | 3 | 1 | 67 | 2 | 0 | 0.79 | 0.65 | 0.18 | 0.71 | 1.47 |
| Lo (2001) | 11 | 1 | 47 | 1 | 0 | 1.22 | 0.70 | 0.04 | 1.25 | 2.64 |
| Malladi (2020) | 1 | 1 | 155 | 1 | 0 | 0.35 | 0.35 | 0.35 | 0.35 |
| Study | #Alphas | #Sources | #Months | #Models | Top5 | Mean | StDev | Min | Md | Max |
|---|---|---|---|---|---|---|---|---|---|---|
| Meligkotsidou and Vrontos (2008) | 20 | 2 | 143 | 1 | 0 | 0.37 | 0.34 | −0.42 | 0.39 | 0.98 |
| Mitchell and Pulvino (2001) | 1 | 1 | 108 | 1 | 1 | 0.61 | 0.61 | 0.61 | 0.61 | |
| Mladina (2015) | 10 | 1 | 240 | 1 | 0 | 0.19 | 0.14 | −0.06 | 0.18 | 0.36 |
| Molyboga and L'Ahelec (2016) | 2 | 1 | 228 | 1 | 0 | 0.19 | 0.35 | −0.06 | 0.19 | 0.43 |
| Mozes (2013) | 10 | 1 | 234 | 5 | 0 | 0.20 | 0.16 | −0.13 | 0.27 | 0.34 |
| Patton and Ramadorai (2013) | 23 | 4 | 186 | 4 | 1 | 0.26 | 0.22 | −0.39 | 0.33 | 0.63 |
| Racicot and Théoret (2009) | 47 | 1 | 108 | 1 | 0 | 0.57 | 0.83 | 0.07 | 0.36 | 5.11 |
| Racicot and Théoret (2013) | 5 | 1 | 183 | 1 | 0 | 0.05 | 0.20 | −0.19 | 0.03 | 0.31 |
| Racicot and Théoret (2014) | 24 | 1 | 183 | 3 | 0 | −0.07 | 0.85 | −1.65 | −0.07 | 1.22 |
| Ranaldo and Favre (2005) | 42 | 1 | 152 | 3 | 0 | 0.71 | 0.26 | 0.24 | 0.65 | 1.14 |
| Diez De Los Rios and Garcia (2011) | 11 | 1 | 99 | 1 | 0 | 0.35 | 0.09 | 0.20 | 0.36 | 0.53 |
| Rzakhanov and Jetley (2019) | 7 | 1 | 264 | 1 | 0 | 0.36 | 0.21 | 0.15 | 0.32 | 0.71 |
| Sabbaghi (2012) | 20 | 1 | 203 | 1 | 0 | 0.18 | 0.35 | −0.70 | 0.25 | 0.70 |
| Sadka (2010) | 11 | 1 | 180 | 1 | 1 | 0.42 | 0.12 | 0.23 | 0.46 | 0.62 |
| Sadka (2012) | 12 | 1 | 192 | 1 | 0 | 0.33 | 0.13 | 0.09 | 0.35 | 0.56 |
| Sandvik et al. (2011) | 36 | 1 | 182 | 1 | 0 | 0.13 | 0.25 | −0.31 | 0.09 | 0.82 |
| Stafylas et al. (2018) | 40 | 2 | 291 | 1 | 0 | 0.39 | 0.52 | −1.18 | 0.39 | 1.58 |
| Stafylas and Andrikopoulos (2020) | 24 | 2 | 291 | 1 | 0 | 0.51 | 0.43 | 0.04 | 0.37 | 1.71 |
| Stoforos et al. (2017) | 26 | 1 | 237 | 1 | 0 | −0.22 | 0.92 | −3.64 | 0.21 | 0.58 |
| Sullivan (2021) | 28 | 2 | 312 | 5 | 0 | 0.26 | 0.18 | −0.02 | 0.23 | 0.62 |
| Sun et al. (2012) | 10 | 1 | 192 | 1 | 1 | 0.47 | 0.12 | 0.31 | 0.48 | 0.62 |
| Teo (2009) | 5 | 3 | 78 | 2 | 1 | 0.59 | 0.22 | 0.33 | 0.50 | 0.86 |
| Vrontos et al. (2008) | 5 | 1 | 144 | 5 | 0 | 0.50 | 0.02 | 0.47 | 0.51 | 0.52 |
| Total #Alphas | 1019 | |||||||||
| Total #Studies | 74 | |||||||||
| Mean | 13.77 | 1.70 | 168.99 | 1.95 | 0.30 | 0.37 | 0.28 | −0.08 | 0.36 | 0.86 |
| Study | #Alphas | #Sources | #Months | #Models | Top5 | Mean | StDev | Min | Md | Max |
|---|---|---|---|---|---|---|---|---|---|---|
| StDev | 13.16 | 1.32 | 77.41 | 1.45 | 0.46 | 0.31 | 0.23 | 0.66 | 0.29 | 0.81 |
| Min | 1.00 | 1.00 | 31.00 | 1.00 | 0.00 | −0.51 | 0.01 | −3.64 | −0.51 | −0.37 |
| Md | 9.00 | 1.00 | 171.00 | 1.00 | 0.00 | 0.35 | 0.20 | 0.06 | 0.36 | 0.62 |
| Max | 61.00 | 7.00 | 475.00 | 7.00 | 1.00 | 1.22 | 0.92 | 1.18 | 1.25 | 5.11 |
Note: The table shows descriptive statistics for the alpha coefficients reported in the individual primary studies (sorted alphabetically). #Alphas denotes the number of alpha estimates that meet our sample collection criteria reported in a given study. #Sources shows the number of databases the alpha estimates in the primary study are based on. #Months specifies the number of months of the data sample used in the primary study covers. #Models shows the number of risk models used to estimate the alphas in the primary study. Top5 is the indicator variable equal to 1 if the study is published in the Journal of Finance, the Journal of Financial Economics, the Review of Financial Studies, the Journal of Financial and Quantitative Analysis, and the Review of Finance, and 0 otherwise. The Mean, StDev, Min, Md, and Max refer to the mean value, the standard deviation, the minimum, the median value, and the maximum of the alpha coefficients reported in the primary study.
![Figure 5. Funnel plot of alphas. [Colour figure can be viewed at wileyonlinelibrary.com]](figures/fig5.png)
Note: When there is no publication bias, estimates should be symmetrically distributed around the mean denoted by the solid red vertical line. The gray dashed line denotes 0. Outliers are excluded from the figure for ease of exposition but included in all statistical tests.
In our setting, the association can be depicted with a funnel plot with the alpha coefficients on the x-axis and their precision (i.e., 1/SE) on the y-axis. We show such a funnel plot in Figure 5. In a bias-free world, the graph should resemble a symmetrical inverted funnel. The funnel shape arises because the most precise estimates tend to be concentrated around the underlying mean value, whereas less precise estimates with larger standard errors are more dispersed around the mean. The funnel plot shall be symmetric if, for any given level of estimate precision, both high and low estimates are equally likely to be published. Contrast, if imprecise estimates that are high tend to be reported, while equally imprecise estimates that are low get discarded, then the funnel plot shall miss some observations in the left part and consequently, it shall be asymmetric. An asymmetric funnel plot indicates that estimates are reported selectively in primary studies, which implies that their mean value provides a biased estimate of the underlying mean value in the population.
Figure 5 exhibits no obvious asymmetry, which is consistent with little or no publication bias. For any given level of precision, both high and low estimates seem to be represented in the plot. The funnel plot, thus, provides initial suggestive evidence indicating that hedge fund alpha estimates reported in primary studies are not significantly contaminated by publication selection bias. Furthermore, a simple visual examination of Figure 5 suggests that the funnel plot is slightly “hollow,” which might suggest that insignificant estimates (low precision alpha close to zero) are less likely to be published. Below we formally test for the significance of these observed patterns.
4.2. Formal tests
Having provided preliminary evidence about the likelihood of a publication selection bias in hedge fund performance literature, we proceed with using several approaches to formally test for it. The first set of tests exploits the above-mentioned association between the alpha coefficients reported in primary studies and their standard errors. Since we use the term “alpha” to refer to the intercept term in the regression of returns on risk factors reported in primary studies, we use “kappa” to denote the constant (i.e., the intercept term) in our regressions of alpha coefficients on their standard errors. Furthermore, we use “lambda” to refer to the slope coefficient at the explanatory variable of SE. We estimate the following equation:
where stands for the th estimate of hedge fund alpha reported in the th study, denotes its standard error, and is the error term.
In the absence of any publication bias, the slope coefficient is expected to be zero, which implies no association between the alpha estimates () and their standard errors (). In contrast, if the publication of estimated alpha coefficients is selective and low alpha estimates are more likely to remain unreported in primary studies, then imprecise estimates (i.e., those with a large SE) should be more likely to be high rather than low leading to a positive coefficient. Conversely, a tendency to discard high rather than low alpha coefficients would lead to a negative coefficient. Hence, the slope coefficient reflects the effect of publication selection bias, and the intercept term captures the true mean alpha estimate corrected for the bias.
Panel A of Table 2 shows the results for several alternative ways of estimating Equation (2). In the first column, we report the conventional ordinary least squares (OLS) estimate. As discussed above, the OLS estimate represents the most straightforward way of testing for selective publication that is commonly used in prior research. However, it could yield spurious results in case unobserved features of the primary study design are correlated with the reported alphas. To address this potential problem, we complement the OLS estimates with several alternative estimation techniques. The results reported in the second column of Table 2 are based on an estimation that includes study-level FEs. Including study-level FEs filters out idiosyncratic study-level variation. Hence, as long as alpha estimates in a given primary study are estimated using similar methodologies, including study-level FEs removes the potential confounding effect of these methodological choices on the reported alpha estimates. Identification of the FE estimator rests on studies that report more than one estimate. Thus, we complement the analysis with study-level between-effect estimation (BE) that accounts for the differences in study size. We report these results in the third column of Table 2.
To further address the issue of potential endogeneity in the method choices and reported standard errors in the primary studies, we follow Stanley (2005), Bajzik et al. (2020), Cazachevici et al. (2020), Matousek et al. (2022), Havranek et al. (2023), Ehrenbergerova et al. (2023), and Irsova et al. (2023) and use the inverse of the square root of the number of observations in primary studies as an IV for the standard error. This measure has the desirable characteristics of a valid instrument. By construction, the number of observations is correlated with the standard error. At the same time, it is plausibly unrelated to the chosen estimation technique. Furthermore, it seems reasonable to assume that the number of observations is quasi-randomly distributed among the primary studies. The results based on this instrument, thus, constitute an important robustness check. We report these results in the fourth column in Table 2.
| Panel A: Linear models | ||||||
|---|---|---|---|---|---|---|
| OLS | FE | BE | IV | WLS | wNOBS | |
| Publication bias () | −0.0152 | −0.0265 | 0.0602 | 0.178 | 0.324 | 0.0497 |
| (0.188) | (0.215) | (0.131) | (0.353) | (0.320) | (0.127) | |
| [−0.534, 0.455] | [−0.526, 0.971] | [−0.415, 1.120] | [−0.348, 0.457] | |||
| {−0.626, 0.983} | ||||||
| Effect beyond bias () | 0.366∗∗∗ | 0.369∗∗∗ | 0.350∗∗∗ | 0.316∗∗∗ | 0.301∗∗∗ | 0.353∗∗∗ |
| (0.0426) | (0.0540) | (0.0474) | (0.0854) | (0.0440) | (0.0380) | |
| [0.277, 0.458] | [0.157, 0.475] | [0.186, 0.412] | [0.270, 0.436] | |||
| First-stage robust F-stat | 12.71 | |||||
| Studies | 74 | 74 | 74 | 73 | 74 | 74 |
| Observations | 1019 | 1019 | 1019 | 979 | 1019 | 1019 |
| Panel B: Nonlinear models | ||||||
| Top10 | WAAP | Stem-based | Kinked-meta | Selection model | p-uniform* | |
| Publication bias | 0.183∗ | = .631 | = 0.364 | |||
| (0.106) | (0.092) | ( = .834) | ||||
| Effect beyond bias | 0.310∗∗∗ | 0.325∗∗∗ | 0.355∗∗∗ | 0.320∗∗∗ | 0.274∗∗∗ | 0.386∗∗∗ |
| (0.026) | (0.009) | (0.093) | (0.008) | (0.03) | (0.045) | |
| Studies | 74 | 74 | 74 | 74 | 74 | 74 |
| Observations | 1019 | 1019 | 1019 | 1019 | 1019 | 1019 |
Note: The first two panels report the results of the regression , where denotes the th alpha coefficient estimated in the th study, and denotes its standard error. FE: study-level fixed effects, BE: study-level between effects, IV: the inverse of the square root of the number of observations is used as an instrument for the standard error, WLS: model is weighted by the inverse of the standard error of an estimate, wNOBS: model is weighted by the inverse of the number of estimates per study. In Panel B, Top10 is model by Stanley et al. (2010), WAAP stands for Weighted Average of the Adequately Powered model by Ioannidis et al. (2017), Kinked-meta is endogenous kink model by Bom and Rachinger (2019), Stem model is by Furukawa (2020), selection is model by Andrews and Kasy (2019) using clustered SEs, denotes the probability that estimates insignificant at the 5% level are published relative to the probability that significant estimates are published (normalized at 1), p-uni∗ is by van Aert and van Assen (2020), denotes test statistic of p-uniform’s publication bias test. Standard errors, clustered at the study level, are reported in parentheses. 95% confidence intervals from wild bootstrap in square brackets (Roodman et al., 2018). In curly brackets, we show the two-step weak-instrument-robust 95% confidence interval based on Andrews (2018) and Sun (2018). ∗ p < 0.10, ∗∗ p < 0.05, ∗∗∗ p < 0.01.
In the last two columns of Panel A of Table 2, we report our weighted least squares estimates of Equation (2). In the fifth column, we weigh the observations by the inverse of their standard error (WLS). This approach gives less weight to less precise estimates, which helps to adjust for potential heteroskedasticity in our observations. The sixth column shows our results from estimation when the observations are weighted by the inverse of the number of estimates reported in a given study (wNOBS). This approach provides a more comparable basis for larger and smaller studies.
Considering the above-discussed results reported in Panel A of Table 2, we find little evidence of publication selection bias for the alpha estimates reported in the primary studies. The coefficients that capture the effect of selective publication are all small in magnitude and statistically insignificant. These findings are remarkably consistent across the alternative ways of estimating Equation (2). Thus, consistent with our preliminary findings based on the funnel plot in Figure 5, our formal tests provide evidence consistent with the nonselective publication of estimated monthly alphas in the primary studies in our sample.
Panel A of Table 2 also shows the estimates that reflect the estimated magnitude of the monthly alphas adjusted for the publication selection bias. We observe that these estimates range between 0.301 and 0.369, and they are strongly statistically significant at a better than 1% level in all specifications. It is noteworthy that the unconditional mean of monthly alpha estimates of 0.36 highlighted in the histogram in Figure 3 falls within this range of estimates corrected for the publication selection bias. Considering perhaps the most conservative estimate reported in Panel A of Table 2, we observe that the lower bound of the bootstrapped confidence interval of the IV specification is 0.157. This suggests that the true hedge fund alpha is unlikely to be below 1.9% per annum (0.157*12). These results further strengthen our earlier conclusion that the alpha estimates in our sample are not contaminated by selective publication, and hedge funds do earn positive alphas for their investors.
Our estimates of Equation (2) reported in Panel A of Table 2 are subject to several limitations. First, these tests of selective publication are based on an assumption of a linear relationship between the estimate and its standard error. In reality, this association may not be linear. For example, it may exhibit discontinuities around conventional levels of statistical significance, that is, when the t-statistics approaches 1.96. Second, the IV specification may not fully remedy the endogeneity problem because it may arise for reasons other than the bias due to omitted variables related to the research design in primary studies. Gechert et al. (2022) point out that endogeneity may arise even when deliberately reporting spuriously precise estimates, for example, due to reverse causality. Furthermore, since the standard error is itself an estimate, endogeneity can also manifest itself through the measurement error. We address these shortcomings in Panel B of Table 2. To address the first issue, we use nonlinear techniques for publication bias correction. To address the second limitation, we use the p-uniform* approach recently developed by van Aert and van Assen (2020) that does not rely on the assumption of exogeneity.
In the first column of Panel B of Table 2, we report results based on the Top10 method proposed by Stanley et al. (2010). The method is based on a simple proposition that the bias arising from aggregating potentially selectively reported coefficients can be addressed by simply considering only the 10% most precise estimates. The second column of Panel B of Table 2 shows results based on the Weighted Average of the Adequately Powered (WAAP) model proposed by Ioannidis et al. (2017). Similarly to Top10, also WAAP is based on averaging only a subset of published coefficients. Ioannidis et al. (2017) examine the statistical power of the results published in the field of economics, and they propose dropping all estimates with statistical power lower than 80% and weighting the remaining estimates by the inverse of their variance. In the third column of Panel B of Table 2, we report the results from the Stem-based method recently developed by Furukawa (2020). The stem-based method builds on Stanley et al. (2010), but it aims at limiting the loss of sample variation that results from discarding 90% of the less precise estimates. Furukawa (2020) optimizes the trade-off between the bias and variance, discards only the estimates that do not add value in the light of this trade-off, and uses the remaining estimates to compute the average value. The first three columns in Panel B of Table 2 show estimates ranging from 0.310 to 0.355, which falls within the range documented earlier for the linear methods reported in Panel A (0.301–0.369). Thus, even based on these alternative methods, we reach a similar conclusion on the limited impact of publication bias and on the values of alpha estimates corrected for a potential publication bias.
In the fourth column of Panel B of Table 2, we report results based on the endogenous kink model (Kinked-meta) proposed by Bom and Rachinger (2019). The model is based on the assumption that the relationship between an estimate and its standard error is only linear to some point because, for some levels of reported coefficients, there is no reason to expect the presence of publication bias. Hence, there is an endogenously determined cutoff value (or a “kink”) at which the relationship changes. The Kinked-meta model yields some weak evidence (significant at 10% level) on the presence of selective publication ( 0.183, SE 0.106). Nevertheless, even this approach yields a coefficient of 0.320, which is very close to the uncorrected mean of 0.36 and comfortably within the interval of 0.301 and 0.369 shown in Panel A.
The fifth column of Panel B of Table 2 shows our results for the selection model recently developed by Andrews and Kasy (2019). The model is based on the assumption that the probability of publishing an estimate depends on its statistical significance. The model identifies how likely it is for an estimate to fall into different intervals determined by the critical values of t-statistics. The model gives more weight to intervals that are underrepresented. Our results from the selection model suggest that statistically insignificant estimates may be somewhat less likely to get published than statistically significant estimates (63 vs. 100% probability). However, the corrected mean of alpha estimates decreases only slightly to 0.274. Hence, even this methodological approach does not suggest that inferences about the magnitude of alpha coefficients are greatly affected by selective publication.
The Andrews and Kasy (2019) model relies on several assumptions. It requires the estimates and their standard errors to be statistically independent. It also assumes that the probability of publication is the same for all estimates in a given interval. We test these assumptions in Table A.1 using the Kranz and Putz (2022) framework. These tests suggest some of the underlying assumptions of the selection model (especially the independence assumption) may be violated in many of our samples. Therefore, as robustness checks, we also use models that do not rely on the underlying assumption of no correlation between the estimates and their standard errors in the absence of publication bias.
The last column in Panel B of Table 2 shows the results of the p-uniform* model by van Aert and van Assen (2020). Harvey et al. (2016) and Harvey (2017) suggest that “p-hacking,” that is, a greater tendency to publish statistically significant rather than insignificant results, is a major problem in financial economics research. They argue that “p-hacking” may have led to a number of “false positives” to be reported in published research on factors explaining the cross-sectional variation in realized returns. This introduces important distortions in modeling systematic risk in asset pricing because the association between many of these variables and realized returns is unlikely to persist in the future. Following this argument, we examine potential “p-hacking” in research on hedge fund performance. To do so, we use the p-uniform* model recently proposed by van Aert and van Assen (2020), which is based on evaluating the distribution of p-values around the 5% cutoff level that is conventionally used to assess statistical significance. A tendency to publish statistically significant results implies an over-representation of p-values just below the 5% cutoff and an under-representation of p-values just above it. P-uniform∗ corrects for this potential bias by assigning different weights to estimates of various degrees of statistical significance based on the estimated publication probability. This selection model is robust to the assumption of zero correlation between estimates and standard errors in the absence of any publication bias. Our results based on this methodological approach are consistent with our previous findings. The test statistic for the publication bias (denoted “L”) is statistically insignificant, which again suggests that the publication of alpha estimates in primary studies is not selective. In fact, this method suggests a somewhat higher value of 0.386 for alpha estimates corrected for the publication bias. Thus, we reach similar conclusions about the absence of publication selection bias and a somewhat similar estimate of the true mean value of the alpha coefficient even when using the p-uniform* method, which does not require the exogeneity assumption for the standard errors to be satisfied.
In contrast to the more conventional linear approaches reported in Panel A of Table 2, the more sophisticated nonlinear approaches shown in Panel B of Table 2 do not require the linearity and exogeneity assumptions to be met. Overall, these approaches lead to fairly similar conclusions about the limited impact of selective publication on the alpha estimates reported in primary studies. Only the Kinked-meta model shows some marginally significant evidence of publication selection bias. However, even this approach does not dramatically alter the estimated value of alpha coefficients corrected for the publication bias. Furthermore, the selection model suggests that statistically insignificant estimates may be somewhat less likely to get published. However, the estimate for the mean alpha coefficient does not dramatically change after correcting for this bias. The interval of corrected alpha estimates based on the more sophisticated approaches reported in Panel B is slightly wider, and it ranges from 0.274 to 0.386. However, both the upper bound and the lower bound of this interval are fairly close to the unconditional mean of 0.36. These results thus provide further support for our conclusion that inferences about the magnitude of the alpha coefficient in the literature on hedge fund performance are not significantly affected by publication selection bias.
To complement our analysis, we examine whether our results may be affected by the inclusion of studies that are coauthored by similar research teams. We acknowledge that different teams of co-authors may plausibly have various preferences over the choice of estimation methodology and they may have access to different data sources. Hence, the alpha coefficients estimated by members of a given research team may be interdependent.6 To address this issue, we recompute our results and we cluster the standard errors by author teams. We report these results in Table A.2. These results show that potential interdependencies between the alphas estimated in individual research teams do not materially affect our conclusions. Consistent with our main results, we find little evidence of publication selection bias after clustering the standard errors at the research team level. All the coefficients reported in Table A.2 are statistically insignificant, which suggests against selective publication. Furthermore, the coefficients fall within a fairly narrow interval of (0.301, 0.369) that is fully subsumed by the corresponding interval that we observe for our main results (0.274, 0.386). We thus conclude that clustering of standard errors at the level of a research team leads us to similar conclusions on the absence of selective publication and on the magnitude of the “corrected” alpha estimate as our main results.
Finally, we follow recent advances in econometrics and conduct a test of “p-hacking” based on Elliott et al. (2022). We report the results in Figure A.1 and Table A.3. The “p-hacking” tests are conceptually different from the publication bias tests. Therefore, they constitute a good complement to the results reported earlier in this section. Figure A.1 shows no obvious breaks at the value of 1.96 (represented by the vertical solid red line), which represents the most important threshold for statistical significance at 5% level. Similarly, our formal test show no indication of over-reporting of statistically significant estimates in primary studies (see Table A.3). Consistent with our earlier conclusions, these results also suggest that the pool of empirical evidence on hedge fund performance is not substantially contaminated by selective reporting of estimates in research journals.
We find these results remarkable, especially when contrasted with the abundant empirical evidence on the prevalence of publication selection bias in a multitude of other settings in economics and finance, for example, Stanley (2001, 2005); Stanley and Doucouliagos (2010); Havranek (2015); Brodeur et al. (2016); Bruns and Ioannidis (2016); Stanley and Doucouliagos (2017); Christensen and Miguel (2018); Brodeur et al. (2020); Blanco-Perez and Brodeur (2020), and Zigraiova et al. (2021). We can only speculate about the underlying reasons why we do not observe selective publication in research on hedge fund performance. We consider it likely that the presence of two opposing perspectives, both of which may be quite plausible, limits researchers’ and editors’ incentives to systemically discard either high or low estimates of hedge fund performance. On the one hand, hedge funds likely employ very talented wealth managers who are highly incentivized to generate returns for investors. Hence, it may be reasonable to expect that these bright and highly motivated minds are capable of identifying assets that are temporarily mispriced due to investor irrationality or the impact of passive investment. Hedge funds can possibly earn abnormal returns by investing in these assets, which implies positive alpha coefficients. On the one hand, following the EMH, hedge funds mostly trade on competitive markets where it may be challenging to systematically earn more than the “normal” rate of return. In addition, the high management and performance fees that hedge funds charge may imply that their net-of-fee performance may be inferior to passive indexing. This would imply either insignificant or negative alphas. We consider it plausible that the lack of a clear a priori theoretical prediction about the expected sign of estimated coefficients may limit the incentives for selective reporting and increase the readiness of academic journals to publish both positive and insignificant or negative results on hedge fund performance.
To further strengthen our analysis, we perform several robustness checks intended to ensure that our results are not driven by the heterogeneity in the mix of various alpha coefficients estimated in the primary studies using a wide range of techniques. Heterogeneity in estimation may potentially lead to offsetting biases that would compromise our ability to detect selective publication in the full sample. For example, it is acknowledged that the p-uniform* method tends to overestimate the measured effect when large heterogeneity is present among the estimates collected from the primary studies (Carter et al., 2019). To further strengthen the confidence in our findings and to rule out the possibility that our tests are adversely affected by the diversity of the techniques used in estimating the alpha coefficients in the primary studies, we proceed by analyzing more homogeneous subsets of alpha estimates to determine whether selective publication can be observed in any of these subsamples.
5. SUBSAMPLE RESULTS
In this section, we report our results for various subsamples of our dataset. Our data contain alphas estimated using different data sources and estimation techniques. We argue that it is important to aggregate these different estimates and report the representative alphas, as all estimates reported in primary studies are likely to help shape researchers’ and investors’ views of the abnormal returns that hedge funds earn on average. We assume that different estimation approaches are used in the literature to date because opinions differ about their relative appropriateness. We assume that readers of the research literature on hedge fund performance have differing views on these techniques and rely most heavily on the alphas estimated using the methods they believe to be the best. Our analysis of the full sample recognizes that none of the approaches is universally superior and takes into account all of the estimates that are likely to shape researchers’ and practitioners’ views on the subject. Despite this advantage, the overall results may be affected by the diversity of the underlying data and their impact on the power of our test. To ensure that our results are not affected by the underlying heterogeneity of the data, we re-estimate our regressions for more narrowly defined and, thus, more homogeneous subsamples. We observe whether the results of our subsample are consistent with the results of the whole sample.
We consider several subsamples of more homogeneous alpha estimates. First, we partition our sample based on whether the survivorship and/or backfilling biases are adjusted for in a given primary study. Since these data biases may potentially have a significant impact on the documented returns estimating our regressions for the two subsamples separately lets us draw stronger inferences from our results. Second, we consider alpha coefficients estimated using two commonly used risk models: (i) the one-factor model and (ii) the seven-factor model. Hedge funds exhibit unusual risk exposures to various risk dimensions, and so the choice of a risk model may have an impact on the estimated abnormal return. Third, we recompute our results for the subsample of alpha coefficients estimated with the use of IV. Prior research shows that IV-based estimates are more likely to suffer from a publication bias because they tend to have larger standard errors (Brodeur et al., 2020). We examine whether we detect selective publication in this subset of estimates. Fourth, we report our results for the subsample of alpha estimates published in the top three (the Journal of Finance, the Journal of Financial Economics, the Review of Financial Studies), or the top five (plus the Journal of Financial and Quantitative Analysis, and the Review of Finance) finance journals. These journals are particularly prominent in the field of finance, and so the alpha estimates they publish are likely to be particularly impactful in shaping researchers’ views of hedge funds performance. In addition, many researchers are strongly incentivized to publish their research in these leading journals. This implies that if the publication of hedge fund performance is selective, the bias is likely to be particularly strong in these journals.
To pave the way for computing our subsample results, we visualize in the Appendix the distribution of the alpha coefficients in these subsamples. Figure A.2 shows the histograms and Figure A.3 shows the funnel plots for the individual subsamples we analyze in this section. In the histograms, we do not observe any major deviations from normality. In a similar vein, with the exception of alpha estimates estimated with the use of IV-based methods, the funnel plots are rather symmetric, which points towards little publication selection bias. In the following subsections, we formally test for selective publication in these subsamples.
5.1. Survivorship and backfilling biases
Prior research has long argued that the survivorship and backfilling biases may have a substantial impact on hedge fund performance estimates (Aggarwal & Jorion, 2010; Fung and Hsieh, 2004a; Kosowski et al., 2007). The survivorship bias arises when a data sample excludes performance results of funds that are no longer in existence. From the perspective of data providers, excluding these funds from their database is sensible because funds that no longer operate are not interesting for investors anymore. Nevertheless, since the performance of funds that stop reporting information on their performance to the database may systematically differ from the performance of surviving funds purging this information biases the research results based on the database. The backfilling bias arises when funds undergo an “incubation period” intended to accumulate performance track record before they are offered to investors. If performance history is backfilled into the database only for those funds that succeed in the incubation period, the database overstates the performance of the entire hedge fund population in the early years of their existence.
In the following analysis, we consider separately a subsample of alpha estimates that explicitly controls for the survivorship and/or backfilling biases. Then we consider only those alpha estimates that do not adjust for these biases. Given that the survivorship and backfilling biases may have a significant impact on the estimated alpha coefficients considering only one subsample at a time makes the individual alpha estimates more homogenous. We examine whether our main conclusions on the limited publication selection bias are robust to testing these relationships within the two subsamples.
In Table 3, we report our results for two subsets of alpha estimates: (i) those adjusted for the survivorship and/or backfilling bias are reported in Part 1, and (ii) those adjusted for neither survival bias nor backfilling bias are reported in Part 2. The results based on the conventional approaches reported in Panel A of Part 1 convey a fairly similar albeit slightly weaker message than the results based on the full sample (reported in Table 2). In Panel A of Part 1, all but one 𝜆 coefficient are statistically insignificant. Only for the WLS model, which weighs the observations by the inverse of their standard error, we observe a significant 𝜆 coefficient of 0.472 (SE 0.233, significant at 5% level). This finding provides limited evidence on some publication bias within the subsets of alpha estimates adjusted for the survivorship and/or backfilling biases weighted by their precision. Furthermore, among the results based on the nonlinear approaches reported in Panel B of Part 1, we observe one statistically significant 𝜆 for the Kinked-meta model of 0.519 (SE 0.234, significant at 1% level). Similarly to the WLS model, also Kinked-meta attributes different weights to alpha estimates based on their precision. However, overall, we find only limited evidence of selective publication of alpha coefficients within the subsample of estimates that adjust for the survivorship and/or backfilling biases.
| Part 1: Survivorship and/or backfiling bias treated | ||||||
|---|---|---|---|---|---|---|
| Panel A: linear | OLS | FE | BE | IV | WLS | wNOBS |
| Publication bias () | −0.00148 | −0.0846 | 0.0795 | 0.493 | 0.472∗∗ | 0.0814 |
| (0.180) | (0.0961) | (0.189) | (0.402) | (0.233) | (0.195) | |
| [−0.435, 0.568] | [−0.492, 2.534] | [−0.092, 0.948] | [−0.406, 0.561] | |||
| {−0.342, 1.566} | ||||||
| Effect beyond bias () | 0.329∗∗∗ | 0.351∗∗∗ | 0.300∗∗∗ | 0.194∗ | 0.241∗∗∗ | 0.300∗∗∗ |
| (0.0373) | (0.0252) | (0.0622) | (0.106) | (0.0337) | (0.0487) | |
| [0.243, 0.411] | [−0.104, 0.392] | [0.133, 0.377] | [0.183, 0.403] | |||
| First-stage robust F-stat | 11.29 | |||||
| Studies | 50 | 50 | 50 | 49 | 50 | 50 |
| Observations | 605 | 605 | 605 | 565 | 605 | 605 |
| Panel B: nonlinear | Top10 | WAAP | Stem-based | Kinked-meta | Selection model | p-uniform* |
| Publication bias | 0.519∗∗∗ | = .632 | NA | |||
| (0.125) | (0.115) | (NA) | ||||
| Effect beyond bias | 0.267∗∗∗ | 0.248∗∗∗ | 0.220∗∗∗ | 0.234∗∗∗ | 0.262∗∗∗ | 0.325∗∗∗ |
| (0.028) | (0.017) | (0.068) | (0.012) | (0.029) | (0.048) | |
| Studies | 50 | 50 | 50 | 50 | 50 | 50 |
| Observations | 605 | 605 | 605 | 605 | 605 | 605 |
| Part 2: Survivorship and backfiling biases untreated | ||||||
| Panel A: linear | OLS | FE | BE | IV | WLS | wNOBS |
| Publication bias () | −0.0168 | 0.0491 | 0.0602 | −0.466 | 0.438 | 0.0337 |
| (0.363) | (0.486) | (0.170) | (0.725) | (0.492) | (0.140) | |
| [−0.941, 0.870] | [NA] | [−0.558, 1.749] | [−0.844, 0.671] | |||
| {−5.850, NA} | ||||||
| Effect beyond bias () | 0.416∗∗∗ | 0.400∗∗∗ | 0.436∗∗∗ | 0.521∗∗∗ | 0.334∗∗∗ | 0.443∗∗∗ |
| (0.0782) | (0.114) | (0.0686) | (0.163) | (0.0559) | (0.0563) | |
| [0.245, 0.615] | [NA] | [0.112, 0.482] | [0.326, 0.554] | |||
| First-stage robust F-stat | 3.76 | |||||
| Studies | 29 | 29 | 29 | 29 | 29 | 29 |
| Observations | 414 | 414 | 414 | 414 | 414 | 414 |
| Panel B: nonlinear | Top10 | WAAP | Stem-based | Kinked-meta | Selection model | p-uniform* |
| Publication bias | 0.343∗ | = 0.719 | NA | |||
| (0.191) | (0.124) | (NA) | ||||
| Effect beyond bias | 0.301∗∗∗ | 0.359∗∗∗ | 0.331∗∗∗ | 0.351∗∗∗ | 0.282∗∗∗ | 0.507∗∗∗ |
| (0.038) | (0.012) | (0.040) | (0.009) | (0.086) | (0.077) | |
| Studies | 29 | 29 | 29 | 29 | 29 | 29 |
| Observations | 414 | 414 | 414 | 414 | 414 | 414 |
Note: Part 1: Sample in which both biases are treated for (either the survivorship or the backfiling bias is treated or both biases are treated for). Part 2: Sample in which biases are not treated for (neither the survivorship nor the backfiling bias is treated for). NA = nonconvergence to the result. [NA] = confidence interval could not be bounded. ∗ 𝑝 < .10, ∗∗ 𝑝 < .05, ∗∗∗ 𝑝 < .01.
Results presented in Part 1 of Table 3 also indicate that limiting the analysis to the subsample of estimates adjusted for the survivorship and/or backfilling biases does not dramatically affect the conclusions about the magnitude of the alpha coefficients. The 𝜅 coefficients reported in Part 1 reflect the average alpha coefficients adjusted for the publication selection bias range between 0.194 and 0.351. This range is only slightly lower than the corresponding interval for 𝜅 coefficients based on the full sample between 0.274 and 0.386 reported in Table 2. The most significant deviation from this pattern is the slightly lower and only marginally significant 𝜅 coefficient based on the IV estimate that uses the inverse of the square root of the number of observations as an instrument for the standard error. This 𝜅 of 0.194 (SE 0.106, significant at 10% level) is reported in the fourth column in Panel A of Part 1.
In Part 2 of Table 3, we report results based on the subsample of alpha estimates that do not explicitly control neither for the survivorship nor for the backfilling biases. The conclusion based on this subsample is very similar to the main results reported in Table 2. In line with the fullsample results, the 𝜆 coefficients are statistically insignificant with the exception of the one based on the Kinked-meta model, which is equal to 0.343 and similarly to the full-sample result, it is marginally significant at 10% (SE 0.191). Furthermore, the 𝜅 coefficients reported in Part 2 of Table 3 range between 0.282 and 0.521. Relative to the corresponding range for the 𝜅 coefficients based on the full sample, this range is slightly wider. The difference is mainly driven by the higher upper bound, which is consistent with the proposition that studies that control for survivorship and/or backfilling biases tend to report lower alpha estimates than those that do not. Overall, these findings suggest that the alpha coefficients that are not adjusted for backfilling and survivorship biases are not reported selectively.
5.2. Risk models
One of the key methodological issues in hedge fund performance research concerns the choice of risk models used to adjust for the systematic risk that a given investment strategy involves. These models define the risk dimensions considered relevant for a given investment strategy. Prior hedge fund performance research uses several risk models. Models that feature fewer risk factors (e.g., the CAPM, the three-factor, and the four-factor model) are well-established in general asset pricing and investment research, which implies that the alpha coefficients based on these models are easily comparable with alpha coefficients estimated to evaluate the performance of other types of investments, for example, mutual funds. On the other hand, hedge funds commonly employ complex investment strategies that may exhibit unusual risk profiles and exposures to risk dimensions that are not essential for conventional asset classes. Thus, standard risk models may not fully capture the exposure of hedge funds’ investment strategies to all relevant risk dimensions. More complex risk models featuring additional risk dimensions designed specifically to measure hedge fund performance may thus be more effective in capturing the plurality of risk exposures that hedge fund strategies involve. The choice of a risk model is thus one of the important drivers for the heterogeneity in the alpha coefficients that we collect from primary studies. In evaluating the robustness of our findings to various ways of reducing heterogeneity in our sample, we re-estimate our regressions using two subsamples of alpha coefficients estimated based on two frequently used risk models: (i) the one-factor model, and (ii) the seven-factor model.
Part 1 of Table 4 shows the results of our tests of selective publication for the subset of alpha coefficients based on the one-factor model. In these tests, we include all the alpha estimates that use a single risk factor based on market portfolio returns, that is, both the estimates that use raw market returns and those that use market returns in excess of the risk-free rate. These methodological modifications are relatively small and so we do not expect them to have a substantial impact on the reported alpha coefficients. In line with our earlier results, we do not find evidence of a significant publication bias for this narrowly defined subsample of alpha coefficients. The 𝜆 coefficients that capture the impact of a potential publication bias are all statistically insignificant. This suggests that the alpha estimates based on a one-factor model are not reported selectively in prior literature.
Part 1 of Table 4 also shows that the 𝜅 coefficients that reflect the estimated true magnitude of the alpha estimates corrected for the potential bias range from 0.349 to 0.707. This interval includes the unconditional mean of all the alpha estimates in our sample of 0.36. However, these estimates are somewhat higher than the ones we document for the full sample in Table 2. This may suggest that the single market-based risk factor does not fully control for the systematic risk hedge fund strategies involve and so the abnormal return based on the model is higher. Overall, these results provide additional support for the conclusion that the alpha estimates reported in prior literature are not subject to selective publication.
Prior literature acknowledges that the complexity and the dynamic nature of hedge funds’ investment strategies may induce exposure to risk dimensions that are not included in conventional risk models. Prior research, thus, proposes alternative risk models designed specifically for investment strategies common in hedge funds. The most notable example of these models is the seven-factor model (Fung and Hsieh, 2004a; Fung et al., 2008). The model comprises the following risk factors: (i) the stock market excess return, (ii) the spread between the small capitalization and large capitalization stock returns, the excess return pairs of look-back call and put options (iii) on currency futures, (iv) on commodity futures, and (v) on bond futures, (vi) the durationadjusted change in the yield spread of the U.S. 10-year Treasury bond over the 3-month T-bill, and (vii) the duration-adjusted change in the credit spread of Moody’s BAA bond over the 10-year Treasury bond. These risk factors are intended to capture risk exposures of a broad set of hedge fund types ranging from equity long-short funds to managed futures funds.
In Part 2 of Table 4, we report the results of our tests of selective publication for the alpha coefficients based on the seven-factor model. Similarly to the results on the one-factor model reported in Part 1 of Table 4, the results in Part 2 of Table 4 show little evidence of publication selection bias. The 𝜆 coefficients are insignificant with the exception of the BE that produces marginally significant 𝜆 of 0.305 (SE 0.155, significant at 10% level). Furthermore, the 𝜅 coefficients, which reflect the expected value of abnormal returns generated by hedge funds after adjusting for selective publication, range from 0.128 to 0.326, which is lower than the corresponding range in Part 1 of Table 4.
| Part 1: One-factor model | ||||||
|---|---|---|---|---|---|---|
| Panel A: linear | OLS | FE | BE | IV | WLS | wNOBS |
| Publication bias () | −0.456 | −0.328 | 0.0326 | −1.115 | 0.453 | −0.338 |
| (0.488) | (0.657) | (0.494) | (0.819) | (0.602) | (0.249) | |
| [−1.649, 1.468] | [NA] | [−0.776, 2.269] | [−1.247, 0.909] | |||
| {−3.629, 0.102} | ||||||
| Effect beyond bias () | 0.562∗∗∗ | 0.534∗∗∗ | 0.411∗∗∗ | 0.707∗∗∗ | 0.404∗∗∗ | 0.482∗∗∗ |
| (0.0447) | (0.145) | (0.119) | (0.175) | (0.0883) | (0.0931) | |
| [0.465, 0.642] | [0.324, 1.411] | [0.044, 0.515] | [0.252, 0.702] | |||
| First-stage robust F-stat | 14.47 | |||||
| Studies | 18 | 18 | 18 | 18 | 18 | 18 |
| Observations | 167 | 167 | 167 | 167 | 167 | 167 |
| Panel B: nonlinear | Top10 | WAAP | Stem-based | Kinked-meta | Selection model | p-uniform* |
| Publication bias | 0.450 | = .613 | = 0.188 | |||
| (0.347) | (0.177) | ( = .911) | ||||
| Effect beyond bias | 0.446∗∗∗ | 0.454∗∗∗ | 0.349∗∗ | 0.405∗∗∗ | 0.426∗∗∗ | 0.427∗∗∗ |
| (0.072) | (0.030) | (0.163) | (0.028) | (0.088) | (0.103) | |
| Studies | 18 | 18 | 18 | 18 | 18 | 18 |
| Observations | 167 | 167 | 167 | 167 | 167 | 167 |
| Part 2: Seven-factor model | ||||||
| Panel A: linear | OLS | FE | BE | IV | WLS | wNOBS |
| Publication bias () | −0.142 | −0.0729 | 0.305∗ | 0.624 | 0.0683 | 0.226 |
| (0.137) | (0.0547) | (0.155) | (0.557) | (0.296) | (0.265) | |
| [−0.666, 0.555] | [NA] | [−0.571, 0.948] | [−0.732, 0.644] | |||
| {0.0184, NA} | ||||||
| Effect beyond bias () | 0.326∗∗∗ | 0.308∗∗∗ | 0.200∗∗ | 0.128 | 0.284∗∗∗ | 0.222∗∗∗ |
| (0.0392) | (0.0141) | (0.0730) | (0.150) | (0.0330) | (0.0641) | |
| [0.239, 0.413] | [NA] | [0.132, 0.361] | [0.073, 0.375] | |||
| First-stage robust F-stat | 3.41 | |||||
| Studies | 33 | 33 | 33 | 33 | 33 | 33 |
| Observations | 298 | 298 | 298 | 298 | 298 | 298 |
| Panel B: nonlinear | Top10 | WAAP | Stem-based | Kinked-meta | Selection model | p-uniform* |
| Publication bias | 0.019 | = .900 | = 0.269 | |||
| (0.173) | (0.212) | ( = .874) | ||||
| Effect beyond bias | 0.229∗∗∗ | 0.297∗∗∗ | 0.325∗∗∗ | 0.298∗∗∗ | 0.302∗∗∗ | 0.305∗∗∗ |
| (0.036) | (0.013) | (0.059) | (0.008) | (0.059) | (0.040) | |
| Studies | 33 | 33 | 33 | 33 | 33 | 33 |
| Observations | 298 | 298 | 298 | 298 | 298 | 298 |
Note: Part 1: Sample in which the one-factor model or its modifications are used to estimate the alpha. Part 2: Sample in which the seven-factor model or its modifications are used to estimate the alpha. [NA] = confidence interval could not be bounded. ∗ 𝑝 < .10, ∗∗ 𝑝 < .05, ∗∗∗ 𝑝 < .01.
The range is also below the unconditional mean of all monthly alpha estimates in our sample of 0.36. This magnitude of the 𝜅 coefficients is unlikely to be driven by selective publication.
Taken together, our results do not suggest that the heterogeneity in methodological approaches used for estimating alpha coefficients reported in primary studies is the underlying reason for not detecting any publication bias. We do not observe a significant publication bias even when concentrating on fairly homogeneous subsamples of alphas that are estimated using one of the common risk models.
5.3. Instrumental variables
We further consider a subsample of alphas estimated based on IV, for which selective publication is particularly likely. Prior research shows that IV-based estimates tend to suffer from publication bias more frequently than estimates based on other techniques (Brodeur et al., 2020). The authors argue that research methods that offer researchers more degrees of freedom are more likely to suffer from selective publication as researchers may exercise discretion in choosing research designs that help them achieve results that may be viewed as more attractive for publication. The choice of an IV and the specific way of measuring it give researchers considerable leeway. Researchers may choose to report IV-based estimates that are consistent with their prior beliefs or that are otherwise more attractive for publication. Brodeur et al. (2020) show that when IVs are relatively weak, the second stage results are likely to be close to the conventional thresholds for statistical significance, which is consistent with selectivity in the process that determines what coefficients eventually get published.
Motivated by this argument recently proposed in the research literature, we test for selective publication within the subsample of IV-based alpha coefficients. Primary studies typically use higher moments of the distribution of returns, such as skewness and kurtosis, as IV for the excess returns of the mimicking portfolios. This approach follows earlier research that shows that higher moments of the returns distribution are valid instruments and they are effective in removing the errors-in-variables problem (Durbin, 1954; Dagenais & Dagenais, 1997; Pal, 1980). We collect 46 IV-based alpha estimates from three different studies.
Our results reported in Part 1 of Table 5 are consistent with the proposition in prior literature that IV-based estimates tend to exhibit a greater publication selection bias. Five out of seven 𝜆 coefficients are positive and statistically significant at 5% level or better. The positive association between reported alphas and their standard errors indicates that highly positive alpha estimates tend to be reported when they are rather imprecise, that is, they have a large standard error. Such a pattern is characteristic of selective publication. Furthermore, we also observe that for the subsample of IV-based estimates, the magnitude of the 𝜅 coefficients that represent the expected value of alpha estimates after adjusting for selective publication is substantially lower than in our main results. The 𝜅 coefficients reported in Part 1 of Table 5 range from −0.411 to 0.298, many of them are close to 0, and five out of twelve are actually negative. This suggests that after correcting the IV-based alpha estimates for selective publication, there is only limited evidence that they actually are positive and statistically significant. In fact, in contrast to our previous results, only two out of twelve 𝜅 coefficients are statistically different from zero. Consistent with the a priori expectations, this evidence suggests that the composition of the pool of published IV-based alpha estimates tends to be affected by selective publication. These findings thus provide one of the first pieces of out-of-sample evidence in support of the recent proposition that IV-based estimates are more likely to suffer from publication bias than estimates based on other techniques Brodeur et al. (2020).
| Part 1: Methods using instrumental variables | ||||||
|---|---|---|---|---|---|---|
| Panel A: linear | OLS | FE | BE | IV | WLS | wNOBS |
| Publication bias () | 1.378∗∗∗ | 1.307∗∗ | 3.514 | 2.459 | 2.418∗∗∗ | 1.445∗∗∗ |
| (0.221) | (0.283) | (6.083) | (2.111) | (0.299) | (0.178) | |
| [0.760, 1.634] | [NA] | [1.886, 2.945] | [0.776, 1.647] | |||
| {−1.512, 6.430} | ||||||
| Effect beyond bias () | 0.127 | 0.144 | −0.411 | −0.137 | −0.0601 | 0.104 |
| (0.0851) | (0.0691) | (1.525) | (0.438) | (0.0875) | (0.102) | |
| [−0.102, 0.235] | [NA] | [−0.195, 0.260] | [−0.113, 0.267] | |||
| First-stage robust F-stat | 155.41 | |||||
| Studies | 3 | 3 | 3 | 3 | 3 | 3 |
| Observations | 46 | 46 | 46 | 46 | 46 | 46 |
| Panel B: nonlinear | Top10 | WAAP | Stem-based | Kinked-meta | Selection model | p-uniform* |
| Publication bias | 2.418∗∗∗ | = .341 | = 3.551 | |||
| (0.431) | (0.103) | ( = .169) | ||||
| Effect beyond bias | −0.036 | 0.018 | 0.078 | −0.060 | 0.231∗∗∗ | 0.298∗∗∗ |
| (0.027) | (0.067) | (0.091) | (0.048) | (0.088) | (0.071) | |
| Studies | 3 | 3 | 3 | 3 | 3 | 3 |
| Observations | 46 | 46 | 46 | 46 | 46 | 46 |
| Part 2: Methods not using instrumental variables | ||||||
| Panel A: linear | OLS | FE | BE | IV | WLS | wNOBS |
| Publication bias () | −0.0335 | −0.0230 | 0.0147 | 0.203 | 0.284 | 0.0364 |
| (0.191) | (0.220) | (0.132) | (0.351) | (0.321) | (0.131) | |
| [−0.543, 0.442] | [−0.493, 0.999] | [−0.453, 1.080] | [−0.351, 0.458] | |||
| {−0.597, 1.003} | ||||||
| Effect beyond bias () | 0.366∗∗∗ | 0.363∗∗∗ | 0.358∗∗∗ | 0.305∗∗∗ | 0.308∗∗∗ | 0.353∗∗∗ |
| (0.0429) | (0.0553) | (0.0487) | (0.0849) | (0.0440) | (0.0382) | |
| [0.277, 0.459] | [0.138, 0.469] | [0.192, 0.424] | [0.271, 0.435] | |||
| First-stage robust F-stat | 12.98 | |||||
| Studies | 74 | 74 | 74 | 73 | 74 | 74 |
| Observations | 973 | 973 | 973 | 933 | 973 | 973 |
| Panel B: nonlinear | Top10 | WAAP | Stem-based | Kinked-meta | Selection model | p-uniform* |
| Publication bias | 0.166 | = .636 | = 0.378 | |||
| (0.108) | (0.100) | ( = .828) | ||||
| Effect beyond bias | 0.333∗∗∗ | 0.329∗∗∗ | 0.355∗∗∗ | 0.324∗∗∗ | 0.276∗∗∗ | 0.388∗∗∗ |
| (0.026) | (0.009) | (0.092) | (0.008) | (0.030) | (0.045) | |
| Studies | 74 | 74 | 74 | 74 | 74 | 74 |
| Observations | 973 | 973 | 973 | 973 | 973 | 973 |
Note: Part 1: Sample where the instrumental variable approach (including 2SLS, GMM, Hasuman) is used for estimation of the alpha. Part 2: Sample where the instrumental variable approach is not used for estimation of the alpha (mostly ordinary least squares). [NA] = confidence interval could not be bounded. ∗ 𝑝 < .10, ∗∗ 𝑝 < .05, ∗∗∗ 𝑝 < .01.
In contrast, our results based on the subsample of the remaining alpha coefficients that are not estimated with the use of IV reported in Part 2 of Table 5 are in line with our main results. All 𝜆 coefficients are statistically insignificant, which indicates that these alpha estimates are not substantially affected by the publication selection bias. In comparison to the full-sample results, within this subsample, even the 𝜆 coefficient based on the Kinked-meta model is statistically insignificant. Furthermore, the 𝜅 coefficients fall within a fairly narrow range between 0.276 and 0.388, which is very similar to the full sample result. Taken together, the subsample of alpha coefficients that are not estimated based on IV do not seem to be affected by publication bias and their mean value corrected for any (small) biases are quite close to the unconditional sample mean of 0.36.
5.4. Top journals
In this section, we report our results for the subsample of alpha estimates published in the top three (the Journal of Finance, the Journal of Financial Economics, the Review of Financial Studies), or the top five (plus the Journal of Financial and Quantitative Analysis, and the Review of Finance) finance journals. These journals are particularly prominent in the field of finance, and so the alpha estimates they publish are likely to be particularly impactful in shaping researchers’ views of hedge funds performance. In addition, many researchers are strongly incentivized to publish their research in these leading journals. This implies that if the publication of hedge fund performance is selective, the bias is likely to be particularly strong in these journals.
Table 6 shows our results for the subsamples of alphas collected from the top three (Part 1) and top five (Part 2) finance journals. We observe that these results are mostly consistent with our main findings reported in Table 2. In line with our main results, we find little evidence of publication selection bias for the alpha estimates published in top finance journals. Most of the 𝜆 coefficients that capture the effect of selective publication are statistically insignificant. Furthermore, some of the 𝜆 coefficients are positive and others are negative, which points towards the absence of a systematic tendency to over-report or under-report high estimates of hedge fund performance. Only two 𝜆 coefficients are statistically significant at the conventional 5% level. In Part 1, in the model where the observations are weighted by the inverse of the number of estimates per study (wNOBS), the 𝜆 coefficient is positive and significant. In contrast, Part 2 shows a significant negative 𝜆 coefficient for the model that includes study-level FEs. Thus, the only two statistically significant results point in the opposite direction. Consistent with our main results, we conclude that also our results based on subsamples of alpha estimates published in the top three and top five finance journals exhibit little signs of publication selection bias.
We also observe the magnitude of the 𝜅 estimates that reflect the estimated magnitude of the monthly alphas adjusted for the publication selection bias. These results are again broadly consistent with our main findings based on the full sample. All the 𝜅 coefficients fall within a fairly narrow interval of (0.265, 0.358) for the top three journals and (0.263, 0.355) for the top five journals. These intervals for the “corrected” alphas published in the top finance journals greatly overlap with the corresponding interval that we observe for the full sample (0.274, 0.386). In fact, the intervals for the top finance journals are slightly narrower which may be driven by greater consistency in the data sets and estimation methods that may be required by these leading journals. Thus, we again conclude that our results for the top three and top five finance journals do not materially differ from our main findings based on the full sample.
| Part 1: Top three journals | ||||||
|---|---|---|---|---|---|---|
| Panel A: linear | OLS | FE | BE | IV | WLS | wNOBS |
| Publication bias () | 0.00308 | −0.0876∗ | 0.125 | 0.0711 | 0.241 | 0.131∗∗∗ |
| (0.104) | (0.0469) | (0.0982) | (0.190) | (0.441) | (0.0363) | |
| [−0.226, 0.388] | [NA] | [−1.055, 2.069] | [−0.177, 0.594] | |||
| {−0.301, 0.443} | ||||||
| Effect beyond bias () | 0.328∗∗∗ | 0.352∗∗∗ | 0.358∗∗∗ | 0.310∗∗∗ | 0.274∗∗∗ | 0.356∗∗∗ |
| (0.027) | (0.012) | (0.049) | (0.057) | (0.059) | (0.044) | |
| [0.265, 0.416] | [NA] | [0.086, 0.386] | [0.253, 0.450] | |||
| First-stage robust F-stat | 2.444 | |||||
| Studies | 16 | 16 | 16 | 16 | 16 | 16 |
| Observations | 218 | 218 | 218 | 218 | 218 | 218 |
| Panel B: nonlinear | Top10 | WAAP | Stem-based | Kinked-meta | Selection model | p-uniform* |
| Publication bias | 0.113 | = .817 | = 0.289 | |||
| (0.257) | (0.188) | ( = .866) | ||||
| Effect beyond bias | 0.265∗∗∗ | 0.314∗∗∗ | 0.353∗∗∗ | 0.314∗∗∗ | 0.272∗∗∗ | 0.306∗∗∗ |
| (0.031) | (0.014) | (0.055) | (0.008) | (0.070) | (0.070) | |
| Studies | 16 | 16 | 16 | 16 | 16 | 16 |
| Observations | 218 | 218 | 218 | 218 | 218 | 218 |
| Part 2: Top five journals | ||||||
| Panel A: linear | OLS | FE | BE | IV | WLS | wNOBS |
| Publication bias () | −0.0537 | −0.121∗∗∗ | 0.0916 | −0.00437 | 0.0795 | 0.0893 |
| (0.114) | (0.040) | (0.167) | (0.237) | (0.413) | (0.060) | |
| [−1.000, 0.182] | [NA] | [−1.003, 1.686] | [−0.517, 0.227] | |||
| {−0.469, 0.460} | ||||||
| Effect beyond bias () | 0.300∗∗∗ | 0.317∗∗∗ | 0.354∗∗∗ | 0.287∗∗∗ | 0.279∗∗∗ | 0.355∗∗∗ |
| (0.042) | (0.011) | (0.074) | (0.075) | (0.053) | (0.060) | |
| [0.187, 0.397] | [NA] | [0.114, 0.384] | [0.234, 0.481] | |||
| First-stage robust F-stat | 2.10 | |||||
| Studies | 22 | 22 | 22 | 22 | 22 | 22 |
| Observations | 256 | 256 | 256 | 256 | 256 | 256 |
| Panel B: nonlinear | Top10 | WAAP | Stem-based | Kinked-meta | Selection model | p-uniform* |
| Publication bias | −0.071 | = .956 | = 0.307 | |||
| (0.230) | (0.216) | ( = .858) | ||||
| Effect beyond bias | 0.263∗∗∗ | 0.312∗∗∗ | 0.355∗∗∗ | 0.313∗∗∗ | 0.289∗∗∗ | 0.343∗∗∗ |
| (0.030) | (0.012) | (0.061) | (0.008) | (0.061) | (0.064) | |
| Studies | 22 | 22 | 22 | 22 | 22 | 22 |
| Observations | 256 | 256 | 256 | 256 | 256 | 256 |
Note: Part 1: Sample extracted from top five journals in finance (Journal of Finance, Journal of Financial Economics, Review of Financial Studies, Review of Finance, Journal of Financial and Quantitative Analysis). Part 2: Sample extracted from top three journals in finance (Journal of Finance, Journal of Financial Economics, Review of Financial Studies). [NA] = confidence interval could not be bounded. ∗ 𝑝 < .10, ∗∗ 𝑝 < .05, ∗∗∗ 𝑝 < .01.
| Table | Part | Note | #Studies | #Alphas | Mean | StDev | Min | Md | Max |
|---|---|---|---|---|---|---|---|---|---|
| Table 2 | Full sample | 74 | 1019 | 0.335 | 0.033 | 0.274 | 0.338 | 0.386 | |
| Table 3 | 1 | Bias treated | 50 | 605 | 0.273 | 0.048 | 0.194 | 0.265 | 0.351 |
| Table 3 | 2 | Bias untreated | 29 | 414 | 0.390 | 0.077 | 0.282 | 0.380 | 0.521 |
| Table 4 | 1 | 1F model | 18 | 167 | 0.467 | 0.095 | 0.349 | 0.437 | 0.707 |
| Table 4 | 2 | 7F model | 33 | 298 | 0.269 | 0.061 | 0.128 | 0.298 | 0.326 |
| Table 5 | 1 | Instruments | 3 | 46 | 0.025 | 0.187 | −0.411 | 0.048 | 0.298 |
| Table 5 | 2 | No instruments | 74 | 973 | 0.338 | 0.032 | 0.276 | 0.343 | 0.388 |
| Table 6 | 1 | Top three | 16 | 118 | 0.317 | 0.034 | 0.265 | 0.314 | 0.358 |
| Table 6 | 2 | Top five | 22 | 256 | 0.314 | 0.032 | 0.263 | 0.313 | 0.355 |
Note: The table provides an overview of the results presented in this paper. Table and Part specify the table and its part where the results are reported. Note provides a brief description of a given set of results. #Studies and #Alphas show the number of studies and the number of alpha estimates a given set of results is based on. Mean, StDev, Min, Md, and Max refer to the mean value, the standard deviation, the minimum, the median value, and the maximum of a given set of results.
5.5. Overview
Table 7 provides an overview of our subsample results. The table shows that, for the full sample, our estimates based on various techniques of the “representative” alpha coefficient corrected for the publication selection bias range from 0.274 and 0.386. The mean and median values of 0.335 and 0.338, respectively, are both fairly close to the unconditional sample mean of 0.36. Relative to these full sample results, our estimates of the “representative” alpha have a lower minimum of 0.194 for the subsample of alphas treated for the survivorship and/or backfilling biases, and a higher upper bound for the subsample of alphas untreated for either of the biases. The range of “corrected” alphas is wider and higher for alphas estimated with the use of the one-factor model (0.349, 0.707) relative to the seven-factor model (0.128, 0.326). While the range of the “representative” alpha coefficients estimated without the use of IV (0.276, 0.388) virtually coincides with our full sample results, the range of the “corrected” alpha estimates based on IV techniques (−0.411, 0.298) is substantially wider and includes negative values. Finally, the ranges of the “corrected” alpha estimates based on observations published in the top three (0.265, 0.358) and top five (0.263, 0.355) are only slightly below our full sample results.
Our results make several important contributions to prior literature. First, we synthesize fragmented empirical evidence on hedge fund performance and present estimates that are corrected for any publication selection bias. Second, our results demonstrate that despite the prevalence of the publication selection bias in numerous other research settings, publication may not be selective when there is no strong a priori theoretical prediction about the sign of estimated coefficients, which may induce greater readiness to publish statistically insignificant results. Third, we provide one of the first out-of-sample tests of the proposition by Brodeur et al. (2020) who argues that IV-based estimates tend to suffer from publication bias more frequently than estimates based on other techniques.
6. CONCLUSION
We perform a meta-analysis of prior empirical studies evaluating hedge fund performance. We examine whether published estimates of hedge fund alphas (abnormal returns) are affected by publication bias and by data biases. Prior research detects publication selection bias in a wide range of economic and finance settings, for example, Stanley (2001, 2005); Stanley and Doucouliagos (2010); Rusnak et al. (2013); Havranek (2015); Brodeur et al. (2016); Bruns and Ioannidis (2016); Havranek et al. (2017); Stanley and Doucouliagos (2017); Christensen and Miguel (2018); Havranek et al. (2018); Astakhov et al. (2019); Havranek et al. (2018); Brodeur et al. (2020); Havranek et al. (2018); Blanco-Perez and Brodeur (2020), and Zigraiova et al. (2021). In contrast to these findings, using a wide range of techniques and data partitions we do not detect selective publication in hedge fund performance literature with the exception of estimates based on instrumental variables. In contrast, we provide evidence that not controlling for the potential biases in the underlying data (e.g., the backfilling bias and the survivorship bias) affects reported alpha coefficients systematically.
The fragmentation of hedge fund performance data and the wide range of alternative approaches for controlling for risk give researchers considerable discretion over the design of their research. This potentially creates opportunities for selective publication because the use of various estimation techniques based on different data sources may yield diverse results, some of which may be more attractive for publication than others. Our results demonstrate that despite the prevalence of publication selection bias in numerous other research settings, publication may not be selective when there is no strong a priori theoretical prediction about the sign of estimated coefficients, which may induce greater readiness to publish statistically insignificant results.
The heterogeneity in methodological approaches and data sources used in estimating hedge funds’ alphas opens up additional research opportunities. Future research can examine whether and how the various aspects of methodological choices affect the magnitude of reported alpha coefficients. Our aim in this paper is to propose a representative alpha coefficient that is aggregated across the plurality of these approaches and corrected for publication and data biases. Therefore, in this study, we provide robustness checks based on subsamples that narrow down the pool of collected alpha estimates to more homogeneous subsets but we do not explicitly exploit the full sample heterogeneity to analyze and draw conclusions about individual subsets or about the relative magnitude of alpha coefficients for the individual subsets. We leave the analysis of the impact of this heterogeneity on the reported alpha coefficients for future research that can examine the importance of various dimensions of methodological choices on the alpha coefficients reported in primary studies.
ACKNOWLEDGMENTS
Yang acknowledges support from the Czech Science Foundation (project 21-09231S). Havranek acknowledges support from the NPO Systemic Risk Institute number LX22NPO5101, funded by European Union—Next Generation EU (Ministry of Education, Youth and Sports, NPO: EXCELES). Irsova acknowledges support from the Czech Science Foundation (project 23-05227M). Novak acknowledges support from the Czech Science Foundation (project 19-26812X).
DATA AVAILABILITY STATEMENT
Data and code are available in an online appendix at http://www.meta-analysis.cz/hedge.
ORCID
Jiri Novak https://orcid.org/0000-0003-0647-1463
REFERENCES
Some entries below were printed without a link. Where a Crossref record matches one and no other record plausibly could, its DOI is shown; ambiguous references are left as they were printed.
- Ackermann, C., McEnally, R., & Ravenscraft, D. (1999). The performance of hedge funds: Risk, return, and incentives. The Journal of Finance, 54(3), 833–874. 10.1111/0022-1082.00129
- Agarwal, V., Arisoy, Y., & Naik, N. Y. (2017). Volatility of aggregate volatility and hedge fund returns. Journal of Financial Economics, 125(3), 491–510. 10.1016/j.jfineco.2017.06.015
- Agarwal, V., Daniel, N. D., & Naik, N. Y. (2009). Role of managerial incentives and discretion in hedge fund performance. The Journal of Finance, 64(5), 2221–2256. 10.1111/j.1540-6261.2009.01499.x
- Agarwal, V., Fos, V., & Jiang, W. (2013). Inferring reporting-related biases in hedge fund databases from hedge fund equity holdings. Management Science, 59(6), 1271–1289. 10.1287/mnsc.1120.1647
- Agarwal, V., Mullally, K. A., & Naik, N. Y. (2015). The economics and finance of hedge funds: A review of the academic literature. Foundations and Trends in Finance, 10(1), 1–111. 10.1561/0500000047
- Agarwal, V., & Naik, N. Y. (2000). On taking the ‘alternative’ route: The risks, rewards, and performance persistence of hedge funds. The Journal of Alternative Investments, 2(4), 6–23. 10.3905/jai.2000.318973
- Aggarwal, R. K., & Jorion, P. (2010). Hidden survivorship in hedge fund returns. Financial Analysts Journal, 66(2), 69–74.
- Ahoniemi, K., & Jylha, P. (2014). Flows, price pressure, and hedge fund returns. Financial Analysts Journal, 70(5), 73–93. 10.2469/faj.v70.n5.1
- Aiken, A., Clifford, C. P., & Ellis, J. (2013). Out of the dark: Hedge fund reporting biases and commercial databases. Review of Financial Studies, 26(1), 208–243. 10.1093/rfs/hhs100
- Amin, G. S., & Kat, H. M. (2003). Hedge fund performance 1990–2000: Do the ‘money machines’ really add value? Journal of Financial and Quantitative Analysis, 38(2), 251–274. 10.2307/4126750
- Ammann, M., & Moerth, P. (2005). Impact of fund size on hedge fund performance. Journal of Asset Management, 6(3), 219–238. 10.1057/palgrave.jam.2240177
- Ammann, M., & Moerth, P. (2008a). Impact of fund size and fund flows on hedge fund performance. The Journal of Alternative Investments, 11(1), 78–96. 10.3905/jai.2008.708851
- Ammann, M., & Moerth, P. (2008b). Performance of funds of hedge funds. The Journal of Wealth Management, 11(1), 46–63. 10.3905/jwm.2008.706272
- Andrews, I. (2018). Valid two-step identification-robust confidence sets for GMM. The Review of Economics and Statistics, 100(2), 337–348. 10.1162/rest_a_00682
- Andrews, I., & Kasy, M. (2019). Identification of and correction for publication bias. American Economic Review, 109(8), 2766–2794. 10.1257/aer.20180310
- Aragon, G. O. (2007). Share restrictions and asset pricing: Evidence from the hedge fund industry. Journal of Financial Economics, 83(1), 33–58. 10.1016/j.jfineco.2005.11.001
- Asness, C., Krail, R., & Liew, J. (2001). Do hedge funds hedge? The Journal of Portfolio Management, 28(1), 6–19.
- Astakhov, A., Havranek, T., & Novak, J. (2019). Firm size and stock returns: A quantitative survey. Journal of Economic Surveys, 33(5), 1463–1492. 10.1111/joes.12335 Full text on this site
- Bajzik, J., Havranek, T., Irsova, Z., & Schwarz, J. (2020). Estimating the Armington elasticity: The importance of data choice and publication bias. Journal of International Economics, 127(C), 103383. 10.1016/j.jinteco.2020.103383 Full text on this site
- Bali, T. G., Brown, S., & Demirtas, K. O. (2013). Do hedge funds outperform stocks and bonds? Management Science, 59(8), 1887–1903. 10.1287/mnsc.1120.1689
- Barth, D., Joenvaara, J., Kauppila, M., & Wermers, R. (2020). The hedge fund industry is bigger (and has performed better) than you think [OFR Working paper 20-01]. Office of Financial Research (OFR), U.S. Department of the Treasury.
- Ben-David, I., Birru, J., & Rossi, A. (2020). The performance of hedge fund performance fees [NBER Working paper 27454]. National Bureau of Economic Research.
- Bhardwaj, G., Gorton, G. B., & Rouwenhorst, K. G. (2014). Fooling some of the people all of the time: The inefficient performance and persistence of commodity trading advisors. Review of Financial Studies, 27(11), 3099–3132. 10.1093/rfs/hhu040
- Billio, M., Frattarolo, L., & Pelizzon, L. (2014). A time-varying performance evaluation of hedge fund strategies through aggregation. Bankers, Markets & Investors, (129), 40–58.
- Black, F. (1972). Capital market equilibrium with restricted borrowing. The Journal of Business, 45(3), 444–455. 10.1086/295472
- Blanco-Perez, C., & Brodeur, A. (2020). Publication bias and editorial statement on negative findings. The Economic Journal, 130(629), 1226–1247. 10.1093/ej/ueaa011
- Blitz, D. (2018). Are hedge funds on the other side of the low-volatility trade? The Journal of Alternative Investments, 21(1), 17–26. 10.3905/jai.2018.21.1.017
- Bollen, N. P., & Pool, V. K. (2009). Do hedge fund managers misreport returns? Evidence from the pooled distribution. The Journal of Finance, 64(5), 2257–2288. 10.1111/j.1540-6261.2009.01500.x
- Bollen, N. P. B., & Whaley, R. E. (2009). Hedge fund risk dynamics: Implications for performance appraisal. The Journal of Finance, 64(2), 985–1035. 10.1111/j.1540-6261.2009.01455.x
- Bom, P. R. D., & Rachinger, H. (2019). A kinked meta-regression model for publication bias correction. Research Synthesis Methods, 10(4), 497–514. 10.1002/jrsm.1352
- Brodeur, A., Cook, N., & Heyes, A. (2020). Methods matter: P-hacking and publication bias in causal analysis in economics. American Economic Review, 110(11), 3634–3660. 10.1257/aer.20190687
- Brodeur, A., Le, M., Sangnier, M., & Zylberberg, Y. (2016). Star Wars: The Empirics Strike Back. American Economic Journal: Applied Economics, 8(1), 1–32. 10.1257/app.20150044
- Brown, R. (2012). Framework for hedge fund return and risk attribution. The Journal of Investing, 21(4), 8–23. 10.3905/joi.2012.21.4.008
- Brown, S. J., Goetzmann, W. N., & Ibbotson, R. G. (1999). Offshore hedge funds: Survival and performance, 1989–95. The Journal of Business, 72(1), 91–117. 10.1086/209603
- Bruns, S. B., & Ioannidis, J. P. A. (2016). p-Curve and p-Hacking in observational research. PloS ONE, 11(2), e0149144. 10.1371/journal.pone.0149144
- Buraschi, A., Kosowski, R., & Trojani, F. (2014). When there is no place to hide: Correlation risk and the cross-section of hedge fund returns. The Review of Financial Studies, 27(2), 581–616. 10.1093/rfs/hht070
- Cao, C., Goldie, B., Liang, B., & Petrasek, L. L. (2016). What is the nature of hedge fund manager skills? Evidence from the risk-arbitrage strategy. Journal of Financial and Quantitative Analysis, 51(3), 929–957. 10.1017/s0022109016000387
- Capocci, D., & Hubner, G. (2004). Analysis of hedge fund performance. Journal of Empirical Finance, 11(1), 55–89. 10.1016/j.jempfin.2002.12.002
- Carter, E. C., Schonbrodt, F. D., Gervais, W. M., & Hilgard, J. (2019). Correcting for bias in psychology: A comparison of meta-analytic methods. Advances in Methods and Practices in Psychological Science, 2(2), 115–144. 10.1177/2515245919847196
- Cassar, G., & Gerakos, J. (2011). Hedge funds: Pricing controls and the smoothing of self-reported returns. The Review of Financial Studies, 24(5), 1698–1734. 10.1093/rfs/hhq139
- Cazachevici, A., Havranek, T., & Horvath, R. (2020). Remittances and economic growth: A meta-analysis. World Development, 134, 105021. 10.1016/j.worlddev.2020.105021 Full text on this site
- Chen, Y., Cliff, M., & Zhao, H. (2017). Hedge funds: The good, the bad, and the lucky. Journal of Financial and Quantitative Analysis, 52(3), 1081–1109. 10.1017/s0022109017000217
- Chen, Y., & Liang, B. (2007). Do market timing hedge funds time the market? Journal of Financial and Quantitative Analysis, 42(4), 827–856. 10.1017/s0022109000003410
- Chincarini, L., & Nakao, A. (2011). Measuring hedge fund timing ability across factors. The Journal of Investing, 20(4), 50–70. 10.3905/joi.2011.20.4.050
- Christensen, G., & Miguel, E. (2018). Transparency, reproducibility, and the credibility of economics research. Journal of Economic Literature, 56(3), 920–980. 10.1257/jel.20171350
- Clark, K. A., & Winkelmann, K. D. (2004). Active risk budgeting in action. The Journal of Alternative Investments, 7(3), 35–46. 10.3905/jai.2004.461456
- Coggin, T., Fabozzi, F., & Rahman, S. (1993). The investment performance of U.S. equity pension fund managers: An empirical investigation. The Journal of Finance, 48(3), 1039–1055.
- Connor, G., & Woo, M. (2004). An introduction to hedge funds [Discussion paper 477]. Financial Markets Group, The London School of Economics and Political Science.
- Dagenais, M. G., & Dagenais, D. L. (1997). Higher moment estimators for linear regression models with errors in the variables. Journal of Econometrics, 76(1–2), 193–221. 10.1016/0304-4076(95)01789-5
- Dichev, I. D., & Yu, G. (2011). Higher risk, lower returns: What hedge fund investors really earn. Journal of Financial Economics, 100(2), 248–263. 10.1016/j.jfineco.2011.01.003
- Diez De Los Rios, A., & Garcia, R. (2011). Assessing and valuing the nonlinear structure of hedge fund returns. Journal of Applied Econometrics, 26(2), 193–212. 10.1002/jae.1147
- Ding, B., & Shawky, H. A. (2007). The performance of hedge fund strategies and the asymmetry of return distributions. European Financial Management, 13(2), 309–331. 10.1111/j.1468-036x.2006.00356.x
- Ding, B., Shawky, H. A., & Tian, J. (2009). Liquidity shocks, size and the relative performance of hedge fund strategies. Journal of Banking & Finance, 33(5), 883–891. 10.1016/j.jbankfin.2008.10.003
- Do, V., Faff, R., & Wickramanayake, J. (2005). An empirical analysis of hedge fund performance: The case of Australian hedge funds industry. Journal of Multinational Financial Management, 15(4), 377–393. 10.1016/j.mulfin.2005.04.006
- Duarte, J., Longstaff, F. A., & Yu, F. (2007). Risk and return in fixed-income arbitrage: Nickels in front of a steamroller? The Review of Financial Studies, 20(3), 769–811. 10.1093/rfs/hhl026
- Durbin, J. (1954). Errors in variables. Revue de l’institut International de Statistique, 22(1–3), 23–32. 10.2307/1401917
- Easley, D., Michayluk, D., O’Hara, M., & Putniņš, T. J. (2021). The active world of passive investing. Review of Finance, 25(5), 1433–1471. 10.1093/rof/rfab021
- Edelman, D., Fung, W., Hsieh, D., & N.Naik, N. (2012). Funds of hedge funds: Performance, risk and capital formation 2005 to 2010. Financial Markets and Portfolio Management, 26(1), 87–108. 10.1007/s11408-011-0180-z
- Edelman, D., Fung, W., & Hsieh, D. A. (2013). Exploring uncharted territories of the hedge fund Industry: Empirical characteristics of mega hedge fund firms. Journal of Financial Economics, 109(3), 734–758. 10.1016/j.jfineco.2013.04.003
- Edwards, F. R., & Caglayan, M. O. (2001). Hedge fund performance and manager skill. Journal of Futures Markets, 21(11), 1003–1028. 10.1002/fut.2102
- Egger, M., Smith, G. D., Schneider, M., & Minder, C. (1997). Bias in meta-analysis detected by a simple, graphical test. BMJ: British Medical Journal, 315(7109), 629–634. 10.1136/bmj.315.7109.629
- Ehrenbergerova, D., Bajzik, J., & Havranek, T. (2023). When does monetary policy sway house prices? A meta-analysis. IMF Economic Review, 71(2), 538–573. 10.1057/s41308-022-00185-5 Full text on this site
- Eling, M., & Faust, R. (2010). The performance of hedge funds and mutual funds in emerging markets. Journal of Banking & Finance, 34(8), 1993–2009. 10.1016/j.jbankfin.2010.01.008
- Elliott, G., Kudrin, N., & Wuthrich, K. (2022). Detecting p-hacking. Econometrica, 90(2), 887–906. 10.3982/ecta18583
- Fama, E. F. (1970). Efficient capital markets: A review of theory and empirical work. Journal of Finance, 25(2), 383–417.
- Frydenberg, S., Hrafnkelsson, K., Bromseth, V. S., & Westgaard, S. (2017). Hedge fund strategies and time-varying alphas and betas. The Journal of Wealth Management, 19(4), 44–60. 10.3905/jwm.2017.19.4.044
- Fung, H.-G., Xu, X. E., & Yau, J. (2002). Global hedge funds: Risk, return, and market timing. Financial Analysts Journal, 58(6), 19–30. 10.2469/faj.v58.n6.2483
- Fung, W., & Hsieh, D. A. (1997). Empirical characteristics of dynamic trading strategies: The case of hedge funds. The Review of Financial Studies, 10(2), 275–302. 10.1093/rfs/10.2.275
- Fung, W., & Hsieh, D. A. (2000). Performance characteristics of hedge funds and commodity funds: Natural vs. spurious biases. Journal of Financial and Quantitative Analysis, 35(3), 291–307. 10.2307/2676205
- Fung, W., & Hsieh, D. A. (2001). The risk in hedge fund strategies: Theory and evidence from trend followers. The Review of Financial Studies, 14(2), 313–341. 10.1093/rfs/14.2.313
- Fung, W., & Hsieh, D. A. (2004a). Hedge fund benchmarks: A risk-based approach. Financial Analysts Journal, 60(5), 65–80. 10.2469/faj.v60.n5.2657
- Fung, W., & Hsieh, D. A. (2004b). Extracting portable alphas from equity long-short hedge funds. Journal of Investment Management, 2(4), 57–75.
- Fung, W., Hsieh, D. A., Naik, N. Y., & Ramadorai, T. (2008). Hedge funds: Performance, risk, and capital formation. The Journal of Finance, 63(4), 1777–1803. 10.1111/j.1540-6261.2008.01374.x
- Fung, W. K., & Hsieh, D. A. (2006). Hedge funds: An industry in its adolescence. Federal Reserve Bank of Atlanta Economic Review, 91, 1–34.
- Furukawa, C. (2020). Publication bias under aggregation frictions: Theory, evidence, and a new correction method [MIT Working paper]. MIT.
- Gârleanu, N., & Pedersen, L. H. (2022). Active and passive investing: Understanding Samuelson’s dictum. The Review of Asset Pricing Studies, 12(2), 389–446. 10.1093/rapstu/raab020
- Gechert, S., Havranek, T., Irsova, Z., & Kolcunova, D. (2022). Measuring capital-labor substitution: The importance of method choices and publication bias. Review of Economic Dynamics, 45(C), 55–82. 10.1016/j.red.2021.05.003 Full text on this site
- Getmansky, M., Lee, P. A., & Lo, A. W. (2015). Hedge funds: A dynamic industry in transition [NBER Working paper 21449]. National Bureau of Economic Research.
- Griffin, J. M., & Xu, J. (2009). How smart are the smart guys? A unique view from hedge fund stock holdings. The Review of Financial Studies, 22(7), 2531–2570. 10.1093/rfs/hhp026
- Gupta, B., Cerrahoglu, B., & Daglioglu, A. (2003). Evaluating hedge fund performance: Traditional versus conditional approaches. The Journal of Alternative Investments, 6(3), 7–24. 10.3905/jai.2003.319096
- Harvey, C. R. (2017). Presidential address: The scientific outlook in financial economics. The Journal of Finance, 72(4), 1399–1440. 10.1111/jofi.12530
- Harvey, C. R., Liu, Y., & Zhu, H. (2016). . . . and the cross-section of expected returns. The Review of Financial Studies, 29(1), 5–68. 10.1093/rfs/hhv059
- Havranek, T. (2015). Measuring intertemporal substitution: The importance of method choices and selective reporting. Journal of the European Economic Association, 13(6), 1180–1204.
- Havranek, T., Herman, D., & Irsova, Z. (2018). Does daylight saving save electricity? A meta-analysis. The Energy Journal, 39(2), 35–61. 10.5547/01956574.39.2.thav Full text on this site
- Havranek, T., & Irsova, Z. (2010a). Measuring bank efficiency: A meta-regression analysis. Prague Economic Papers, 2010(4), 307–328.
- Havranek, T., & Irsova, Z. (2010b). Meta-analysis of intra-industry FDI spillovers: Updated evidence. Czech Journal of Economics and Finance (Finance a uver), 60(2), 151–174.
- Havranek, T., Irsova, Z., Laslopova, L., & Zeynalova, O. (2023). Publication and attenuation biases in measuring skill substitution. The Review of Economics and Statistics, forthcoming.
- Havranek, T., Irsova, Z., & Vlach, T. (2018). Measuring the income elasticity of water demand: The importance of publication and endogeneity biases. Land Economics, 94(2), 259–283. 10.3368/le.94.2.259 Full text on this site
- Havranek, T., Irsova, Z., & Zeynalova, O. (2018). Tuition fees and university enrolment: A meta-regression analysis. Oxford Bulletin of Economics and Statistics, 80(6), 1145–1184. 10.1111/obes.12240 Full text on this site
- Havranek, T., & Rusnak, M. (2013). Transmission lags of monetary policy: A meta-analysis. International Journal of Central Banking, 9(4), 39–76.
- Havranek, T., Rusnak, M., & Sokolova, A. (2017). Habit formation in consumption: A meta-analysis. European Economic Review, 95, 142–167. 10.1016/j.euroecorev.2017.03.009 Full text on this site
- Havranek, T., Stanley, T. D., Doucouliagos, H., Bom, P., Geyer-Klingeberg, J., Iwasaki, I., Reed, W. R., Rost, K., & van Aert, R. C. M. (2020). Reporting guidelines for meta-analysis in economics. Journal of Economic Surveys, 34(3), 469–475. 10.1111/joes.12363 Full text on this site
- Hodder, J. E., Jackwerth, J. C., & Kolokolova, O. (2014). Recovering delisting returns of hedge funds. Journal of Financial and Quantitative Analysis, 49(3), 797–815. 10.1017/s0022109014000465
- Hong, X. (2014). The dynamics of hedge fund share restrictions. Journal of Banking & Finance, 49(C), 82–99. 10.1016/j.jbankfin.2014.08.002
- Huang, Y. S., Chen, C. R., & Kato, I. (2017). Different strokes by different folks: The dynamics of hedge fund systematic risk exposure and performance. International Review of Economics & Finance, 48(C), 367–388. 10.1016/j.iref.2017.01.001
- Ibbotson, R. G., Chen, P., & Zhu, K. X. (2011). The ABCs of hedge funds: Alphas, betas, and costs. Financial Analysts Journal, 67(1), 15–25. 10.2469/faj.v67.n1.6
- Ioannidis, J. P., Stanley, T. D., & Doucouliagos, H. (2017). The power of bias in economics research. The Economic Journal, 127(605), F236–F265. 10.1111/ecoj.12461
- Irsova, Z., Bom, P. R. D., & Rachinger, H. (2023). Spurious precision in meta-analysis [CEPR Discussion papers 17927].
- Jame, R. (2018). Liquidity provision and the cross section of hedge fund returns. Management Science, 64(7), 3288–3312. 10.1287/mnsc.2016.2687
- Jensen, M. C. (1968). The performance of mutual funds in the period 1945–1964. The Journal of Finance, 23(2), 389–416.
- Joenvaara, J., Kaupila, M., Kosowski, R., & Tolonen, P. (2019). Hedge fund performance: What do we know? [CEPR Working paper]. CEPR.
- Joenvaara, J., & Kosowski, R. (2021). The effect of regulatory constraints on fund performance: New evidence from UCITS hedge funds. Review of Finance, 25(1), 189–233.
- Joenvaara, J., Kosowski, R., & Tolonen, P. (2019). The effect of investment constraints on hedge fund investor returns. Journal of Financial and Quantitative Analysis, 54(4), 1539–1571. 10.1017/s0022109018001333
- Jordan, A., & Simlai, P. (2011). Risk characterization, stale pricing and the attributes of hedge funds performance. Journal of Derivatives & Hedge Funds, 17(C), 16–33. 10.1057/jdhf.2011.5
- Jorion, P., & Schwarz, C. (2014). The strategic listing decisions of hedge funds. Journal of Financial and Quantitative Analysis, 49(3), 773–796. 10.1017/s0022109014000350
- Jylha, P., Rinne, K., & Suominen, M. (2014). Do hedge funds supply or demand liquidity? Review of Finance, 18(4), 1259–1298. 10.1093/rof/rft033
- Kanuri, S. (2020). Hedge fund performance in Japan. Review of Pacific Basin Financial Markets and Policies, 23(03), 2050023. 10.1142/s021909152050023x
- Klein, P., Purdy, D., Schweigert, I., & Vedrashko, A. (2015). The Canadian hedge fund industry: Performance and market timing. International Review of Finance, 15(3), 283–320. 10.1111/irfi.12055
- Kooli, M., & Stetsyuk, I. (2021). Are hedge fund managers skilled? Global Finance Journal, 49(C), 100574. 10.1016/j.gfj.2020.100574
- Kosowski, R., Naik, N. Y., & Teo, M. (2007). Do hedge funds deliver alpha? A Bayesian and bootstrap analysis. Journal of Financial Economics, 84(1), 229–264. 10.1016/j.jfineco.2005.12.009
- Kotkatvuori-Ornberg, J., Nikkinen, J., & Peltomaki, J. (2011). Geographical focus in emerging markets and hedge fund performance. Emerging Markets Review, 12(4), 309–320. 10.1016/j.ememar.2011.05.001
- Kranz, S., & Putz, P. (2022). Methods matter: p-Hacking and publication bias in causal analysis in economics: Comment. American Economic Review, 112(9), 3124–3136. 10.1257/aer.20210121
- Liang, B. (1999). On the performance of hedge funds. Financial Analysts Journal, 55(4), 72–85. 10.2469/faj.v55.n4.2287
- Liang, B. (2000). Hedge funds: The living and the dead. Journal of Financial and Quantitative analysis, 35(3), 309–326. 10.2307/2676206
- Liang, B. (2003). The accuracy of hedge fund returns. The Journal of Portfolio Management, 29(3), 111–122. 10.3905/jpm.2003.319889
- Liang, B. (2004). Alternative investments: CTAs, hedge funds, and funds-of-funds. Journal of Investment Management, 2(4), 76–93.
- Ling, Y., Yao, J., & Liu, W. (2015). Chinese hedge funds—performance and risk exposures. The Chinese Economy, 48(5), 330–350. 10.1080/10971475.2015.1067084
- Lintner, J. (1965). Security prices, risk, and maximal gains from diversification. The Journal of Finance, 20(4), 587–615.
- Lo, A. W. (2001). Risk management for hedge funds: Introduction and overview. Financial Analysts Journal, 57(6), 16–33.
- Malkiel, B. G., & Saha, A. (2005). Hedge funds: Risk and return. Financial Analysts Journal, 61(6), 80–88. 10.2469/faj.v61.n6.2775
- Malladi, R. (2020). Luck versus skill in evaluating hedge fund managers’ performance. Journal of Business and Management, 26(1), 22–39. 10.1504/jbm.2020.141278
- Markowitz, H. (1952). Portfolio selection. Journal of Finance, 7(1), 77–91.
- Matousek, J., Havranek, T., & Irsova, Z. (2022). Individual discount rates: A meta-analysis of experimental evidence. Experimental Economics, 25(1), 318–358. 10.1007/s10683-021-09716-9 Full text on this site
- Meligkotsidou, L., & Vrontos, I. D. (2008). Detecting structural breaks and identifying risk factors in hedge fund returns: A Bayesian approach. Journal of Banking & Finance, 32(11), 2471–2481. 10.1016/j.jbankfin.2008.05.007
- Mitchell, M., & Pulvino, T. (2001). Characteristics of risk and return in risk arbitrage. The Journal of Finance, 56(6), 2135–2175. 10.1111/0022-1082.00401
- Mladina, P. (2015). Illuminating hedge fund returns to improve portfolio construction. The Journal of Portfolio Management, 41(3), 127–139. 10.3905/jpm.2015.41.3.127
- Molyboga, M., & L’Ahelec, C. (2016). A simulation-based methodology for evaluating hedge fund investments. Journal of Asset Management, 17(6), 434–452. 10.1057/jam.2016.3
- Mossin, J. (1966). Equilibrium in a capital asset market. Econometrica, 34(4), 768–783. 10.2307/1910098
- Mozes, H. A. (2013). Decomposing hedge fund returns: What hedge funds got right for the past 20 years. The Journal of Investing, 22(3), 9–20. 10.3905/joi.2013.22.3.009
- Pal, M. (1980). Consistent moment estimators of regression coefficients in the presence of errors in variables. Journal of Econometrics, 14(3), 349–364. 10.1016/0304-4076(80)90032-9
- Patton, A. J., & Ramadorai, T. (2013). On the high-frequency dynamics of hedge fund risk exposures. The Journal of Finance, 68(2), 597–635. 10.1111/jofi.12008
- Patton, A. J., Ramadorai, T., & Streatfield, M. (2015). Change you can believe in? Hedge fund data revisions. The Journal of Finance, 70(3), 963–999. 10.1111/jofi.12240
- Posthuma, N., & Van der Sluis, P. J. (2003). A reality check on hedge funds returns (Technical Report). ABP Investments and Department of Finance at Vrije Universiteit Amsterdam. 10.2139/ssrn.438840
- Racicot, F.-E., & Théoret, R. (2009). Integrating volatility factors in the analysis of the hedge fund alpha puzzle. Journal of Asset Management, 10, 37–62. 10.1057/jam.2008.43
- Racicot, F.-E., & Théoret, R. (2013). The procyclicality of hedge fund alpha and beta. Journal of Derivatives & Hedge Funds, 19(C), 109–128. 10.1057/jdhf.2013.3
- Racicot, F.-E., & Théoret, R. (2014). Cumulant instrument estimators for hedge fund return models with errors in variables. Applied Economics, 46(10), 1134–1149. 10.1080/00036846.2013.868591
- Ranaldo, A., & Favre, L. (2005). Hedge fund performance and higher-moment market models. The Journal of Alternative Investments, 8(3), 37–51. 10.3905/jai.2005.608031
- Rathner, S. (2012). The performance of socially responsible investment funds: A meta-analysis [Working paper 2012-03]. Working Papers in Economics and Finance.
- Revelli, C., & Viviani, J.-L. (2015). Financial performance of socially responsible investing (SRI): What have we learned? A meta-analysis. Business Ethics: A European Review, 24(2), 158–185. 10.1111/beer.12076
- Roodman, D., MacKinnon, J. G., Nielsen, M. O., & Webb, M. D. (2018). Fast and wild: Bootstrap inference in Stata using boottest [Queen’s Economics Department Working paper 1406]. Department of Economics, Queen’s University.
- Rusnak, M., Havranek, T., & Horvath, R. (2013). How to solve the price puzzle? A meta-analysis. Journal of Money, Credit and Banking, 45(1), 37–70. 10.1111/j.1538-4616.2012.00561.x Full text on this site
- Rzakhanov, Z., & Jetley, G. (2019). Competition, scale and hedge fund performance: Evidence from merger arbitrage. Journal of Economics and Business, 105(C), 105841. 10.1016/j.jeconbus.2019.04.002
- Sabbaghi, O. (2012). Hedge fund return volatility and comovement: Recent evidence. Managerial Finance, 38(1), 101–119.
- Sadka, R. (2010). Liquidity risk and the cross-section of hedge-fund returns. Journal of Financial Economics, 98(1), 54–71. 10.1016/j.jfineco.2010.05.001
- Sadka, R. (2012). Hedge-fund performance and liquidity risk. Journal of Investment Management, 10(C), 60–72.
- Sandvik, S. H., Frydenberg, S., Westgaard, S., & Heitmann, R. K. (2011). Hedge fund performance in bull and bear markets: Alpha creation and risk exposure. The Journal of Investing, 20(1), 52–77. 10.3905/joi.2011.20.1.052
- Sharpe, W. F. (1966). Mutual fund performance. The Journal of Business, 39(1), 119–138. 10.1086/294846
- Stafylas, D., Anderson, K., & Uddin, M. (2018). Hedge fund performance attribution under various market conditions. International Review of Financial Analysis, 56(C), 221–237. 10.1016/j.irfa.2018.01.006
- Stafylas, D., & Andrikopoulos, A. (2020). Determinants of hedge fund performance during ‘good’ and ‘bad’ economic periods. Research in International Business and Finance, 52(C), 101130. 10.1016/j.ribaf.2019.101130
- Stambaugh, R. F. (2014). Presidential address: Investment noise and trends. The Journal of Finance, 69(4), 1415–1453. 10.1111/jofi.12174
- Stanley, T., & Doucouliagos, H. (2010). Picture this: A simple graph that reveals much ado about research. Journal of Economic Surveys, 24(1), 170–191. 10.1111/j.1467-6419.2009.00593.x
- Stanley, T. D. (2001). Wheat from chaff: Meta-analysis as quantitative literature review. Journal of Economic Perspectives, 15(3), 131–150. 10.1257/jep.15.3.131
- Stanley, T. D. (2005). Beyond publication bias. Journal of Economic Surveys, 19(3), 309–345. 10.1111/j.0950-0804.2005.00250.x
- Stanley, T. D., & Doucouliagos, H. (2017). Neither fixed nor random: Weighted least squares meta-regression. Research Synthesis Methods, 8(1), 19–42. 10.1002/jrsm.1211
- Stanley, T. D., Jarrell, S. B., & Doucouliagos, H. (2010). Could it be better to discard 90% of the data? A statistical paradox. The American Statistician, 64(1), 70–77. 10.1198/tast.2009.08205
- Stoforos, C. E., Degiannakis, S., & Palaskas, T. B. (2017). Hedge fund returns under crisis scenarios: A holistic approach. Research in International Business and Finance, 42(C), 1196–1207. 10.1016/j.ribaf.2017.07.056
- Stulz, R. M. (2007). Hedge funds: Past, present, and future. Journal of Economic Perspectives, 21(2), 175–194. 10.1257/jep.21.2.175
- Sullivan, R. N. (2021). Hedge fund alpha: Cycle or sunset? The Journal of Alternative Investments, 23(3), 55–79.
- Sun, L. (2018). Implementing valid two-step identification-robust confidence sets for linear instrumental-variables models. Stata Journal, 18(4), 803–825. 10.1177/1536867x1801800404
- Sun, Z., Wang, A., & Zheng, L. (2012). The road less traveled: Strategy distinctiveness and hedge fund performance. The Review of Financial Studies, 25(1), 96–143. 10.1093/rfs/hhr092
- Teo, M. (2009). The geography of hedge funds. The Review of Financial Studies, 22(9), 3531–3561. 10.1093/rfs/hhp007
- van Aert, R. C., & van Assen, M. (2020). Correcting for publication bias in a meta-analysis with the p-uniform* method [Working paper]. Tilburg University & Utrecht University.
- Vrontos, S. D., Vrontos, I. D., & Giamouridis, D. (2008). Hedge fund pricing and model uncertainty. Journal of Banking & Finance, 32(5), 741–753. 10.1016/j.jbankfin.2007.05.011
- Zigraiova, D., Havranek, T., Irsova, Z., & Novak, J. (2021). How puzzling is the forward premium puzzle? A meta-analysis. European Economic Review, 134(C), 103714. 10.1016/j.euroecorev.2021.103714 Full text on this site
APPENDIX
![Figure A1. Distribution of t-statistics. [Colour figure can be viewed at wileyonlinelibrary.com]](figures/figA1.png)
Note: The figure represents the distribution of t-statistics of the reported estimates of the alpha. Red lines represent critical value of 1.96 associated with significance at the 5% level and the value of 0 associated with changing the sign of the estimate. We exclude estimates with large t-statistics from the figure for ease of exposition but include them in statistical tests.
![Figure A2. Histograms for subsamples. [Colour figure can be viewed at wileyonlinelibrary.com]](figures/figA2.png)
Note: The figure depicts funnel plots of the reported alphas divided based on the treatment of biases, the implementation of methods (IV = instrumental variables) and models, and the quality of journals in finance. The solid vertical line denotes the sample mean; the dashed vertical line denotes the null alpha.
![Figure A3. Funnel plots for subsamples. [Colour figure can be viewed at wileyonlinelibrary.com]](figures/figA3.png)
Note: The figure depicts funnel plots of the reported alphas divided based on the treatment of biases, the implementation of methods (IV = instrumental variables) and models, and the quality of journals in finance. The solid vertical line denotes the sample mean; the dashed vertical line denotes the null alpha.
| All estimates | Bias treated | Bias not treated | IV estimates | Non-IV estimates | |
|---|---|---|---|---|---|
| Correlation | 0.330 | 0.359 | 0.318 | 0.389 | 0.322 |
| [0.264, 0.392] | [0.275, 0.430] | [0.191, 0.431] | [−0.031, 0.769] | [0.243, 0.379] | |
| Observations | 1019 | 605 | 414 | 46 | 973 |
| One-factor model | Seven-factor model | Top five journals | Top three journals | ||
| Correlation | 0.096 | 0.287 | 0.262 | 0.275 | |
| [−0.091, 0.255] | [0.166, 0.407] | [0.155, 0.375] | [0.159, 0.393] | ||
| Observations | 167 | 298 | 256 | 218 |
Note: The table shows the inverse publication-probability-weighted correlations between and , tests developed by Kranz and Putz (2022) for the viability of Andrews and Kasy (2019) publication bias test. If all the assumptions of the selection model hold, the correlation should be zero. Bootstrapped standard errors in parentheses.
| OLS | FE | BE | IV | WLS | wNOBS | |
|---|---|---|---|---|---|---|
| Publication bias () | −0.0152 | −0.0265 | 0.0602 | 0.178 | 0.324 | 0.0497 |
| (0.171) | (0.206) | (0.131) | (0.359) | (0.310) | (0.124) | |
| [−0.488, 0.365] | [−0.617, 1.114] | [−0.377, 1.097] | [−0.313, 0.458] | |||
| {−0.639, 1.067} | ||||||
| Effect beyond bias () | 0.366∗∗∗ | 0.369∗∗∗ | 0.350∗∗∗ | 0.316∗∗∗ | 0.301∗∗∗ | 0.353∗∗∗ |
| (0.0453) | (0.0516) | (0.0474) | (0.0852) | (0.0440) | (0.0397) | |
| [0.265, 0.470] | [0.150, 0.474] | [0.183, 0.416] | [0.274, 0.434] | |||
| First-stage robust F-stat | 11.71 | |||||
| Studies | 74 | 74 | 74 | 73 | 74 | 74 |
| Observations | 1019 | 1019 | 1019 | 979 | 1019 | 1019 |
Note: The table reports the results of the regression , where denotes the th alpha coefficient estimated in the th study, and denotes its standard error. FE: study-level fixed effects, BE: study-level between effects, IV: the inverse of the square root of the number of observations is used as an instrument for the standard error, WLS: model is weighted by the inverse of the standard error of an estimate, wNOBS: model is weighted by the inverse of the number of estimates per study. Standard errors, clustered at the level of authors, are reported in parentheses. 95% confidence intervals from wild bootstrap in square brackets (Roodman et al., 2018). In curly brackets, we show the two-step weak-instrument-robust 95% confidence interval based on Andrews (2018) and Sun (2018). ∗ p < .10, ∗∗ p < .05, ∗∗∗ p < .01.
| 20 bins | 15 bins | 10 bins | |
|---|---|---|---|
| Test for nonincreasingness | 0.469 | 0.179 | 0.403 |
| Test for monotonicity and bounds | 0.242 | 0.223 | 0.481 |
| Observations () | 663 | 663 | 663 |
| Total observations | 1019 | 1019 | 1019 |
Note: Results of p-hacking tests based on Elliott et al. (2022) for the whole sample.
ENDNOTES
- Source: https://www.azquotes.com/quotes/topics/hedge-fund.html.
- Most of the alphas in our data set are computed on the net-of-fee basis (984 out of 1019, not tabulated), which implies that the average value we report mostly represents abnormal returns net of management and performance fees.
- We explicitly address the issue of “p-hacking” in our research setting in Section 4.2
- Source: https://www.pm-research.com/.
- We are grateful to an anonymous referee for proposing this overview table.
- We are grateful to an anonymous referee for pointing this out.